Immigrants from Bolivia vs Immigrants from Turkey Householder Income Under 25 years
COMPARE
Immigrants from Bolivia
Immigrants from Turkey
Householder Income Under 25 years
Householder Income Under 25 years Comparison
Immigrants from Bolivia
Immigrants from Turkey
$59,389
HOUSEHOLDER INCOME UNDER 25 YEARS
100.0/ 100
METRIC RATING
5th/ 347
METRIC RANK
$52,503
HOUSEHOLDER INCOME UNDER 25 YEARS
68.3/ 100
METRIC RATING
160th/ 347
METRIC RANK
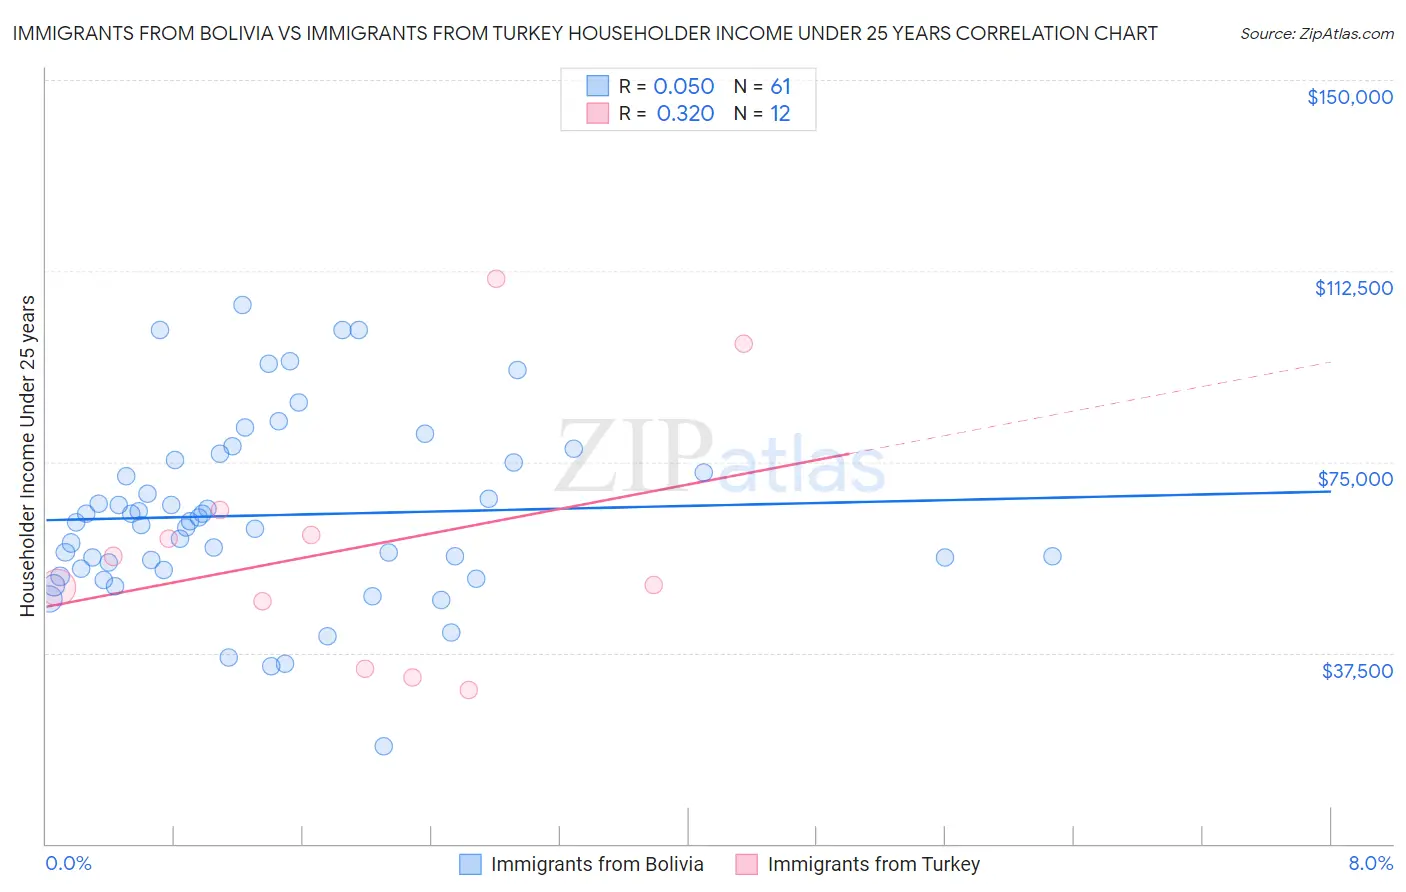
Immigrants from Bolivia vs Immigrants from Turkey Householder Income Under 25 years Correlation Chart
The statistical analysis conducted on geographies consisting of 144,172,056 people shows no correlation between the proportion of Immigrants from Bolivia and household income with householder under the age of 25 in the United States with a correlation coefficient (R) of 0.050 and weighted average of $59,389. Similarly, the statistical analysis conducted on geographies consisting of 195,163,420 people shows a mild positive correlation between the proportion of Immigrants from Turkey and household income with householder under the age of 25 in the United States with a correlation coefficient (R) of 0.320 and weighted average of $52,503, a difference of 13.1%.
Householder Income Under 25 years Correlation Summary
| Measurement | Immigrants from Bolivia | Immigrants from Turkey |
| Minimum | $19,038 | $30,100 |
| Maximum | $105,833 | $110,879 |
| Range | $86,795 | $80,779 |
| Mean | $64,519 | $58,130 |
| Median | $63,188 | $53,646 |
| Interquartile 25% (IQ1) | $53,841 | $40,911 |
| Interquartile 75% (IQ3) | $75,085 | $63,168 |
| Interquartile Range (IQR) | $21,244 | $22,257 |
| Standard Deviation (Sample) | $17,670 | $24,647 |
| Standard Deviation (Population) | $17,525 | $23,598 |
Similar Demographics by Householder Income Under 25 years
Demographics Similar to Immigrants from Bolivia by Householder Income Under 25 years
In terms of householder income under 25 years, the demographic groups most similar to Immigrants from Bolivia are Immigrants from Taiwan ($59,424, a difference of 0.060%), Thai ($59,187, a difference of 0.34%), Immigrants from India ($59,914, a difference of 0.88%), Bolivian ($58,506, a difference of 1.5%), and Indian (Asian) ($58,239, a difference of 2.0%).
| Demographics | Rating | Rank | Householder Income Under 25 years |
| Assyrians/Chaldeans/Syriacs | 100.0 /100 | #1 | Exceptional $65,329 |
| Immigrants | Hong Kong | 100.0 /100 | #2 | Exceptional $62,083 |
| Immigrants | India | 100.0 /100 | #3 | Exceptional $59,914 |
| Immigrants | Taiwan | 100.0 /100 | #4 | Exceptional $59,424 |
| Immigrants | Bolivia | 100.0 /100 | #5 | Exceptional $59,389 |
| Thais | 100.0 /100 | #6 | Exceptional $59,187 |
| Bolivians | 100.0 /100 | #7 | Exceptional $58,506 |
| Indians (Asian) | 100.0 /100 | #8 | Exceptional $58,239 |
| Chinese | 100.0 /100 | #9 | Exceptional $58,162 |
| Afghans | 100.0 /100 | #10 | Exceptional $58,019 |
| Immigrants | China | 100.0 /100 | #11 | Exceptional $57,931 |
| Immigrants | Philippines | 100.0 /100 | #12 | Exceptional $57,930 |
| Immigrants | South Central Asia | 100.0 /100 | #13 | Exceptional $57,818 |
| Filipinos | 100.0 /100 | #14 | Exceptional $57,740 |
| Koreans | 100.0 /100 | #15 | Exceptional $57,730 |
Demographics Similar to Immigrants from Turkey by Householder Income Under 25 years
In terms of householder income under 25 years, the demographic groups most similar to Immigrants from Turkey are Mongolian ($52,540, a difference of 0.070%), Uruguayan ($52,465, a difference of 0.070%), Immigrants from Cambodia ($52,450, a difference of 0.10%), Immigrants from Chile ($52,440, a difference of 0.12%), and Immigrants from Trinidad and Tobago ($52,437, a difference of 0.13%).
| Demographics | Rating | Rank | Householder Income Under 25 years |
| Central Americans | 74.4 /100 | #153 | Good $52,626 |
| Immigrants | Azores | 74.2 /100 | #154 | Good $52,621 |
| Immigrants | Denmark | 73.8 /100 | #155 | Good $52,612 |
| Immigrants | Nepal | 73.7 /100 | #156 | Good $52,611 |
| Ghanaians | 72.9 /100 | #157 | Good $52,594 |
| Immigrants | Netherlands | 72.8 /100 | #158 | Good $52,592 |
| Mongolians | 70.2 /100 | #159 | Good $52,540 |
| Immigrants | Turkey | 68.3 /100 | #160 | Good $52,503 |
| Uruguayans | 66.2 /100 | #161 | Good $52,465 |
| Immigrants | Cambodia | 65.4 /100 | #162 | Good $52,450 |
| Immigrants | Chile | 64.8 /100 | #163 | Good $52,440 |
| Immigrants | Trinidad and Tobago | 64.7 /100 | #164 | Good $52,437 |
| Poles | 63.0 /100 | #165 | Good $52,407 |
| Immigrants | Austria | 62.6 /100 | #166 | Good $52,400 |
| Immigrants | Uganda | 61.1 /100 | #167 | Good $52,374 |