Immigrants from Bolivia vs Colombian Single Father Households
COMPARE
Immigrants from Bolivia
Colombian
Single Father Households
Single Father Households Comparison
Immigrants from Bolivia
Colombians
2.3%
SINGLE FATHER HOUSEHOLDS
76.3/ 100
METRIC RATING
160th/ 347
METRIC RANK
2.3%
SINGLE FATHER HOUSEHOLDS
48.0/ 100
METRIC RATING
177th/ 347
METRIC RANK
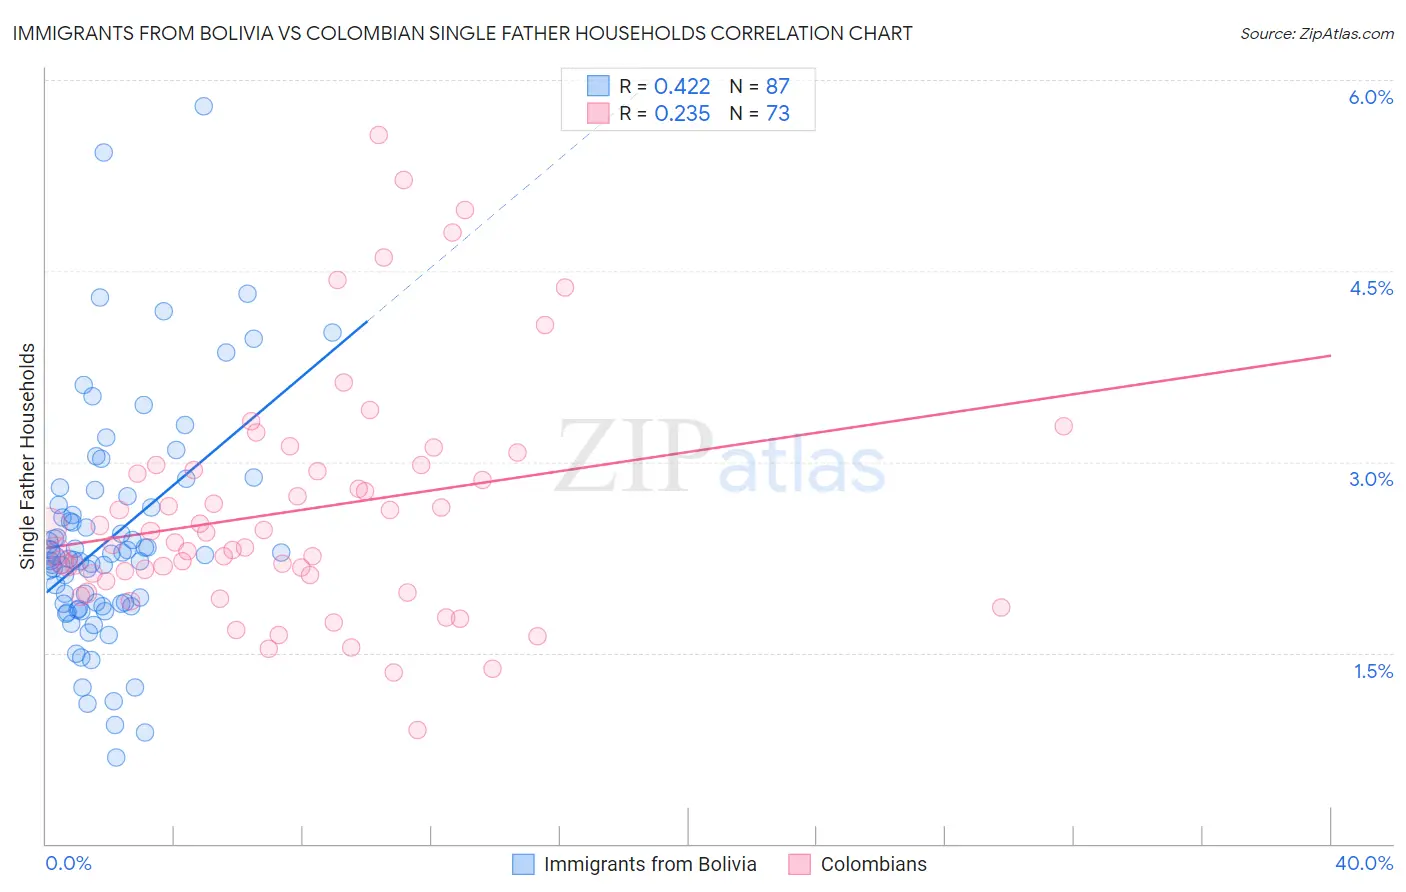
Immigrants from Bolivia vs Colombian Single Father Households Correlation Chart
The statistical analysis conducted on geographies consisting of 158,280,287 people shows a moderate positive correlation between the proportion of Immigrants from Bolivia and percentage of single father households in the United States with a correlation coefficient (R) of 0.422 and weighted average of 2.3%. Similarly, the statistical analysis conducted on geographies consisting of 415,821,309 people shows a weak positive correlation between the proportion of Colombians and percentage of single father households in the United States with a correlation coefficient (R) of 0.235 and weighted average of 2.3%, a difference of 2.3%.
Single Father Households Correlation Summary
| Measurement | Immigrants from Bolivia | Colombian |
| Minimum | 0.67% | 0.89% |
| Maximum | 5.8% | 5.6% |
| Range | 5.1% | 4.7% |
| Mean | 2.4% | 2.6% |
| Median | 2.3% | 2.4% |
| Interquartile 25% (IQ1) | 1.9% | 2.1% |
| Interquartile 75% (IQ3) | 2.7% | 3.0% |
| Interquartile Range (IQR) | 0.80% | 0.87% |
| Standard Deviation (Sample) | 0.90% | 0.93% |
| Standard Deviation (Population) | 0.89% | 0.92% |
Demographics Similar to Immigrants from Bolivia and Colombians by Single Father Households
In terms of single father households, the demographic groups most similar to Immigrants from Bolivia are Immigrants from West Indies (2.3%, a difference of 0.18%), Swiss (2.3%, a difference of 0.30%), Scottish (2.3%, a difference of 0.34%), Immigrants from Senegal (2.3%, a difference of 0.35%), and Irish (2.3%, a difference of 0.41%). Similarly, the demographic groups most similar to Colombians are Danish (2.3%, a difference of 0.010%), Immigrants from Jamaica (2.3%, a difference of 0.080%), Afghan (2.3%, a difference of 0.14%), Costa Rican (2.3%, a difference of 0.29%), and Celtic (2.3%, a difference of 0.55%).
| Demographics | Rating | Rank | Single Father Households |
| Immigrants | Senegal | 79.4 /100 | #158 | Good 2.3% |
| Immigrants | West Indies | 77.9 /100 | #159 | Good 2.3% |
| Immigrants | Bolivia | 76.3 /100 | #160 | Good 2.3% |
| Swiss | 73.2 /100 | #161 | Good 2.3% |
| Scottish | 72.8 /100 | #162 | Good 2.3% |
| Irish | 72.1 /100 | #163 | Good 2.3% |
| Pakistanis | 70.6 /100 | #164 | Good 2.3% |
| Scotch-Irish | 69.4 /100 | #165 | Good 2.3% |
| English | 68.6 /100 | #166 | Good 2.3% |
| South Americans | 64.3 /100 | #167 | Good 2.3% |
| Icelanders | 63.1 /100 | #168 | Good 2.3% |
| Czechs | 62.5 /100 | #169 | Good 2.3% |
| Ugandans | 62.2 /100 | #170 | Good 2.3% |
| Swedes | 61.6 /100 | #171 | Good 2.3% |
| Czechoslovakians | 58.9 /100 | #172 | Average 2.3% |
| Celtics | 55.4 /100 | #173 | Average 2.3% |
| Afghans | 50.0 /100 | #174 | Average 2.3% |
| Immigrants | Jamaica | 49.1 /100 | #175 | Average 2.3% |
| Danes | 48.2 /100 | #176 | Average 2.3% |
| Colombians | 48.0 /100 | #177 | Average 2.3% |
| Costa Ricans | 44.1 /100 | #178 | Average 2.3% |