Spanish vs Alsatian Median Female Earnings
COMPARE
Spanish
Alsatian
Median Female Earnings
Median Female Earnings Comparison
Spanish
Alsatians
$38,098
MEDIAN FEMALE EARNINGS
3.5/ 100
METRIC RATING
241st/ 347
METRIC RANK
$40,060
MEDIAN FEMALE EARNINGS
68.0/ 100
METRIC RATING
161st/ 347
METRIC RANK
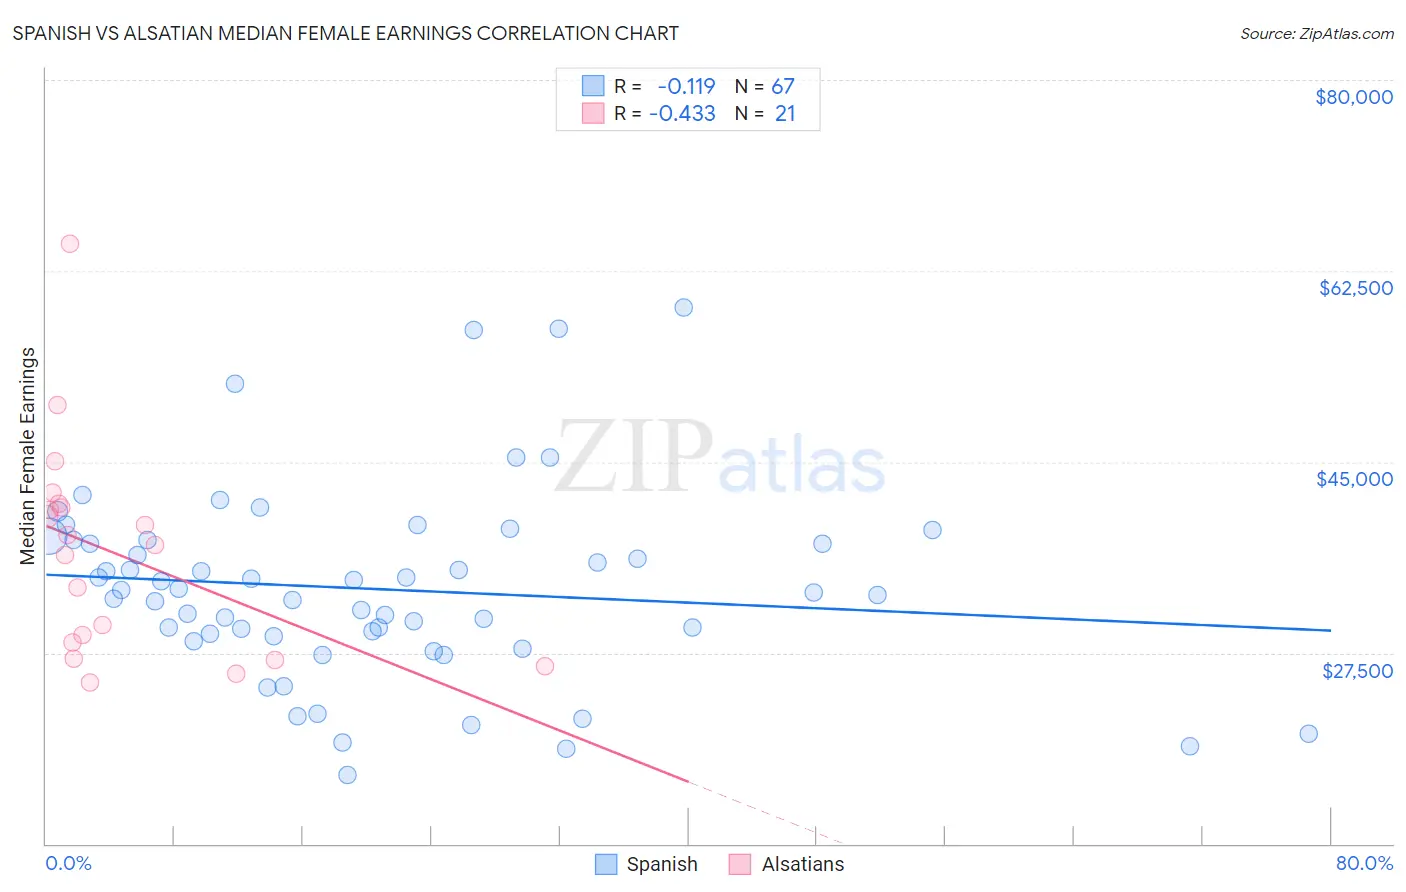
Spanish vs Alsatian Median Female Earnings Correlation Chart
The statistical analysis conducted on geographies consisting of 421,897,645 people shows a poor negative correlation between the proportion of Spanish and median female earnings in the United States with a correlation coefficient (R) of -0.119 and weighted average of $38,098. Similarly, the statistical analysis conducted on geographies consisting of 82,671,266 people shows a moderate negative correlation between the proportion of Alsatians and median female earnings in the United States with a correlation coefficient (R) of -0.433 and weighted average of $40,060, a difference of 5.1%.
Median Female Earnings Correlation Summary
| Measurement | Spanish | Alsatian |
| Minimum | $16,357 | $24,833 |
| Maximum | $59,157 | $65,000 |
| Range | $42,800 | $40,167 |
| Mean | $33,351 | $36,577 |
| Median | $33,021 | $37,425 |
| Interquartile 25% (IQ1) | $29,054 | $27,720 |
| Interquartile 75% (IQ3) | $37,790 | $40,989 |
| Interquartile Range (IQR) | $8,737 | $13,268 |
| Standard Deviation (Sample) | $8,760 | $9,753 |
| Standard Deviation (Population) | $8,694 | $9,518 |
Similar Demographics by Median Female Earnings
Demographics Similar to Spanish by Median Female Earnings
In terms of median female earnings, the demographic groups most similar to Spanish are Immigrants from Burma/Myanmar ($38,028, a difference of 0.18%), Finnish ($38,173, a difference of 0.20%), English ($38,196, a difference of 0.26%), Alaska Native ($38,202, a difference of 0.27%), and Immigrants from Cabo Verde ($38,208, a difference of 0.29%).
| Demographics | Rating | Rank | Median Female Earnings |
| Celtics | 5.0 /100 | #234 | Tragic $38,283 |
| Sudanese | 4.4 /100 | #235 | Tragic $38,215 |
| Liberians | 4.4 /100 | #236 | Tragic $38,215 |
| Immigrants | Cabo Verde | 4.3 /100 | #237 | Tragic $38,208 |
| Alaska Natives | 4.3 /100 | #238 | Tragic $38,202 |
| English | 4.2 /100 | #239 | Tragic $38,196 |
| Finns | 4.0 /100 | #240 | Tragic $38,173 |
| Spanish | 3.5 /100 | #241 | Tragic $38,098 |
| Immigrants | Burma/Myanmar | 3.0 /100 | #242 | Tragic $38,028 |
| Germans | 2.8 /100 | #243 | Tragic $37,986 |
| Immigrants | Liberia | 2.7 /100 | #244 | Tragic $37,970 |
| Immigrants | Middle Africa | 2.7 /100 | #245 | Tragic $37,965 |
| Delaware | 2.6 /100 | #246 | Tragic $37,964 |
| Immigrants | Somalia | 2.4 /100 | #247 | Tragic $37,914 |
| Alaskan Athabascans | 2.3 /100 | #248 | Tragic $37,905 |
Demographics Similar to Alsatians by Median Female Earnings
In terms of median female earnings, the demographic groups most similar to Alsatians are Inupiat ($40,080, a difference of 0.050%), South American Indian ($40,019, a difference of 0.10%), Lebanese ($40,006, a difference of 0.14%), Immigrants from Vietnam ($40,153, a difference of 0.23%), and Immigrants from Senegal ($40,157, a difference of 0.24%).
| Demographics | Rating | Rank | Median Female Earnings |
| Immigrants | Oceania | 77.6 /100 | #154 | Good $40,297 |
| Immigrants | Africa | 76.2 /100 | #155 | Good $40,257 |
| Peruvians | 75.3 /100 | #156 | Good $40,234 |
| Portuguese | 73.0 /100 | #157 | Good $40,177 |
| Immigrants | Senegal | 72.2 /100 | #158 | Good $40,157 |
| Immigrants | Vietnam | 72.0 /100 | #159 | Good $40,153 |
| Inupiat | 68.9 /100 | #160 | Good $40,080 |
| Alsatians | 68.0 /100 | #161 | Good $40,060 |
| South American Indians | 66.1 /100 | #162 | Good $40,019 |
| Lebanese | 65.5 /100 | #163 | Good $40,006 |
| Immigrants | Saudi Arabia | 62.9 /100 | #164 | Good $39,952 |
| Immigrants | Bangladesh | 60.8 /100 | #165 | Good $39,910 |
| Immigrants | Ghana | 60.0 /100 | #166 | Good $39,894 |
| Luxembourgers | 59.9 /100 | #167 | Average $39,891 |
| Immigrants | Peru | 58.9 /100 | #168 | Average $39,871 |