Immigrants from Belize vs Immigrants from North America Unemployment Among Seniors over 75 years
COMPARE
Immigrants from Belize
Immigrants from North America
Unemployment Among Seniors over 75 years
Unemployment Among Seniors over 75 years Comparison
Immigrants from Belize
Immigrants from North America
8.7%
UNEMPLOYMENT AMONG SENIORS OVER 75 YEARS
57.6/ 100
METRIC RATING
166th/ 347
METRIC RANK
9.2%
UNEMPLOYMENT AMONG SENIORS OVER 75 YEARS
2.4/ 100
METRIC RATING
246th/ 347
METRIC RANK
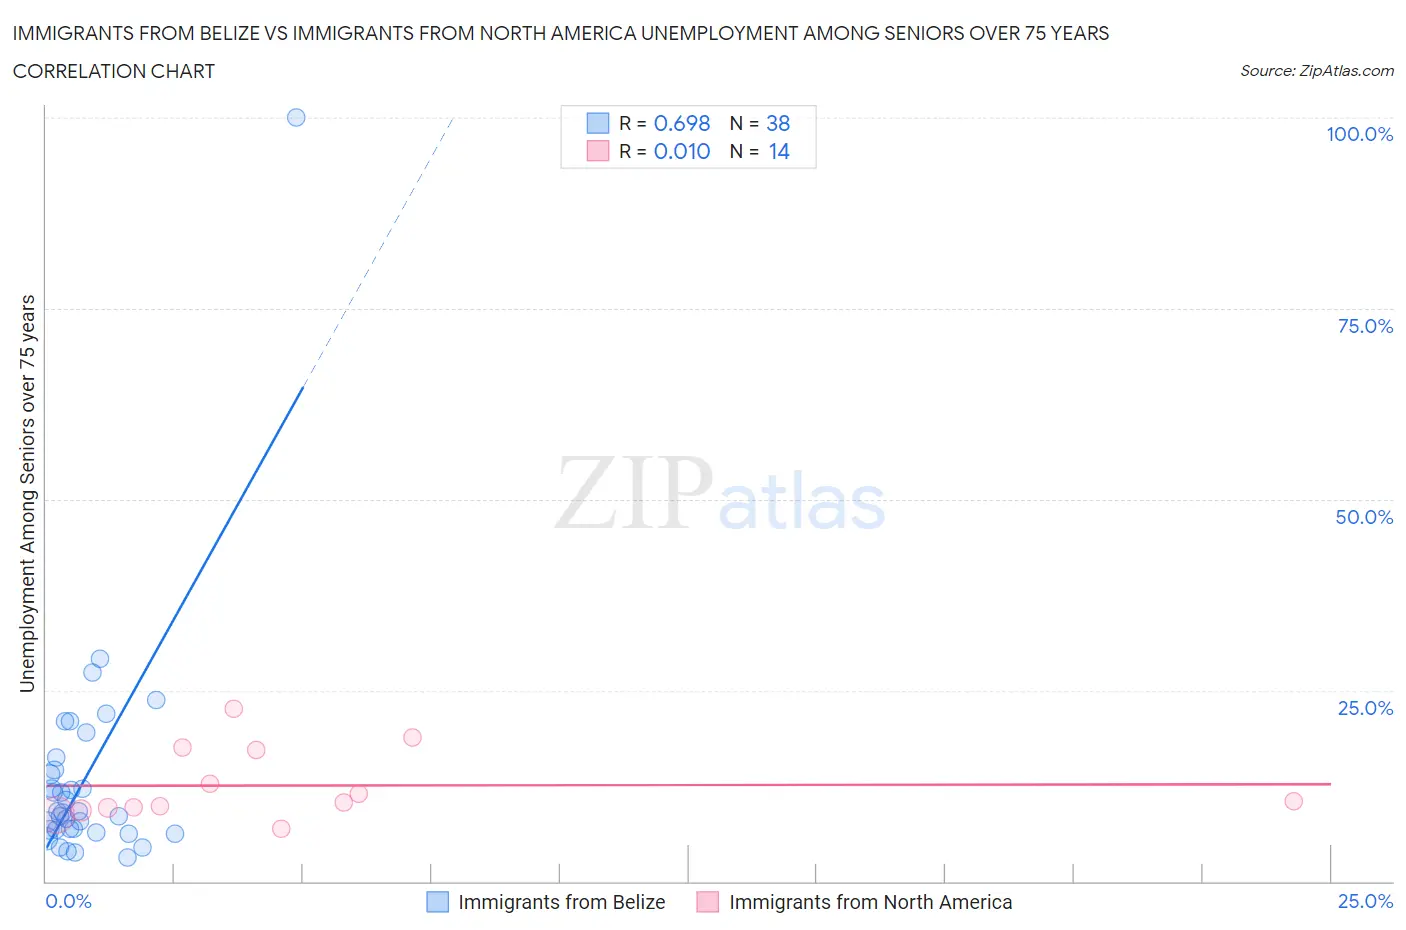
Immigrants from Belize vs Immigrants from North America Unemployment Among Seniors over 75 years Correlation Chart
The statistical analysis conducted on geographies consisting of 92,317,800 people shows a significant positive correlation between the proportion of Immigrants from Belize and unemployment rate among seniors over the age of 75 in the United States with a correlation coefficient (R) of 0.698 and weighted average of 8.7%. Similarly, the statistical analysis conducted on geographies consisting of 218,247,683 people shows no correlation between the proportion of Immigrants from North America and unemployment rate among seniors over the age of 75 in the United States with a correlation coefficient (R) of 0.010 and weighted average of 9.2%, a difference of 5.4%.
Unemployment Among Seniors over 75 years Correlation Summary
| Measurement | Immigrants from Belize | Immigrants from North America |
| Minimum | 3.1% | 6.9% |
| Maximum | 100.0% | 22.6% |
| Range | 96.9% | 15.7% |
| Mean | 13.6% | 12.5% |
| Median | 9.0% | 10.4% |
| Interquartile 25% (IQ1) | 6.8% | 9.7% |
| Interquartile 75% (IQ3) | 14.5% | 17.1% |
| Interquartile Range (IQR) | 7.8% | 7.5% |
| Standard Deviation (Sample) | 15.9% | 4.6% |
| Standard Deviation (Population) | 15.7% | 4.5% |
Similar Demographics by Unemployment Among Seniors over 75 years
Demographics Similar to Immigrants from Belize by Unemployment Among Seniors over 75 years
In terms of unemployment among seniors over 75 years, the demographic groups most similar to Immigrants from Belize are Immigrants from Eastern Africa (8.7%, a difference of 0.0%), Immigrants from Lithuania (8.7%, a difference of 0.020%), Fijian (8.7%, a difference of 0.070%), Zimbabwean (8.7%, a difference of 0.19%), and Immigrants from Dominican Republic (8.7%, a difference of 0.21%).
| Demographics | Rating | Rank | Unemployment Among Seniors over 75 years |
| Shoshone | 74.6 /100 | #159 | Good 8.6% |
| Cree | 72.8 /100 | #160 | Good 8.6% |
| Albanians | 72.8 /100 | #161 | Good 8.6% |
| Immigrants | South America | 71.3 /100 | #162 | Good 8.6% |
| Immigrants | Guatemala | 68.4 /100 | #163 | Good 8.7% |
| Paraguayans | 62.2 /100 | #164 | Good 8.7% |
| Immigrants | Dominican Republic | 61.4 /100 | #165 | Good 8.7% |
| Immigrants | Belize | 57.6 /100 | #166 | Average 8.7% |
| Immigrants | Eastern Africa | 57.6 /100 | #167 | Average 8.7% |
| Immigrants | Lithuania | 57.2 /100 | #168 | Average 8.7% |
| Fijians | 56.4 /100 | #169 | Average 8.7% |
| Zimbabweans | 54.1 /100 | #170 | Average 8.7% |
| Dominicans | 51.9 /100 | #171 | Average 8.7% |
| Immigrants | Immigrants | 51.8 /100 | #172 | Average 8.7% |
| Australians | 50.3 /100 | #173 | Average 8.7% |
Demographics Similar to Immigrants from North America by Unemployment Among Seniors over 75 years
In terms of unemployment among seniors over 75 years, the demographic groups most similar to Immigrants from North America are Subsaharan African (9.2%, a difference of 0.020%), Blackfeet (9.2%, a difference of 0.060%), Immigrants from Saudi Arabia (9.2%, a difference of 0.11%), Immigrants from Canada (9.2%, a difference of 0.12%), and Central American Indian (9.2%, a difference of 0.12%).
| Demographics | Rating | Rank | Unemployment Among Seniors over 75 years |
| Mexicans | 3.5 /100 | #239 | Tragic 9.1% |
| Spanish | 3.3 /100 | #240 | Tragic 9.1% |
| Immigrants | Southern Europe | 2.8 /100 | #241 | Tragic 9.2% |
| Sierra Leoneans | 2.8 /100 | #242 | Tragic 9.2% |
| Slavs | 2.8 /100 | #243 | Tragic 9.2% |
| Immigrants | Germany | 2.7 /100 | #244 | Tragic 9.2% |
| Immigrants | Canada | 2.6 /100 | #245 | Tragic 9.2% |
| Immigrants | North America | 2.4 /100 | #246 | Tragic 9.2% |
| Sub-Saharan Africans | 2.3 /100 | #247 | Tragic 9.2% |
| Blackfeet | 2.3 /100 | #248 | Tragic 9.2% |
| Immigrants | Saudi Arabia | 2.2 /100 | #249 | Tragic 9.2% |
| Central American Indians | 2.2 /100 | #250 | Tragic 9.2% |
| Immigrants | Poland | 2.0 /100 | #251 | Tragic 9.2% |
| Immigrants | Sudan | 2.0 /100 | #252 | Tragic 9.2% |
| Pima | 1.8 /100 | #253 | Tragic 9.2% |