Immigrants from Belgium vs Swedish Householder Income Ages 25 - 44 years
COMPARE
Immigrants from Belgium
Swedish
Householder Income Ages 25 - 44 years
Householder Income Ages 25 - 44 years Comparison
Immigrants from Belgium
Swedes
$112,575
HOUSEHOLDER INCOME AGES 25 - 44 YEARS
100.0/ 100
METRIC RATING
22nd/ 347
METRIC RANK
$99,136
HOUSEHOLDER INCOME AGES 25 - 44 YEARS
92.7/ 100
METRIC RATING
120th/ 347
METRIC RANK
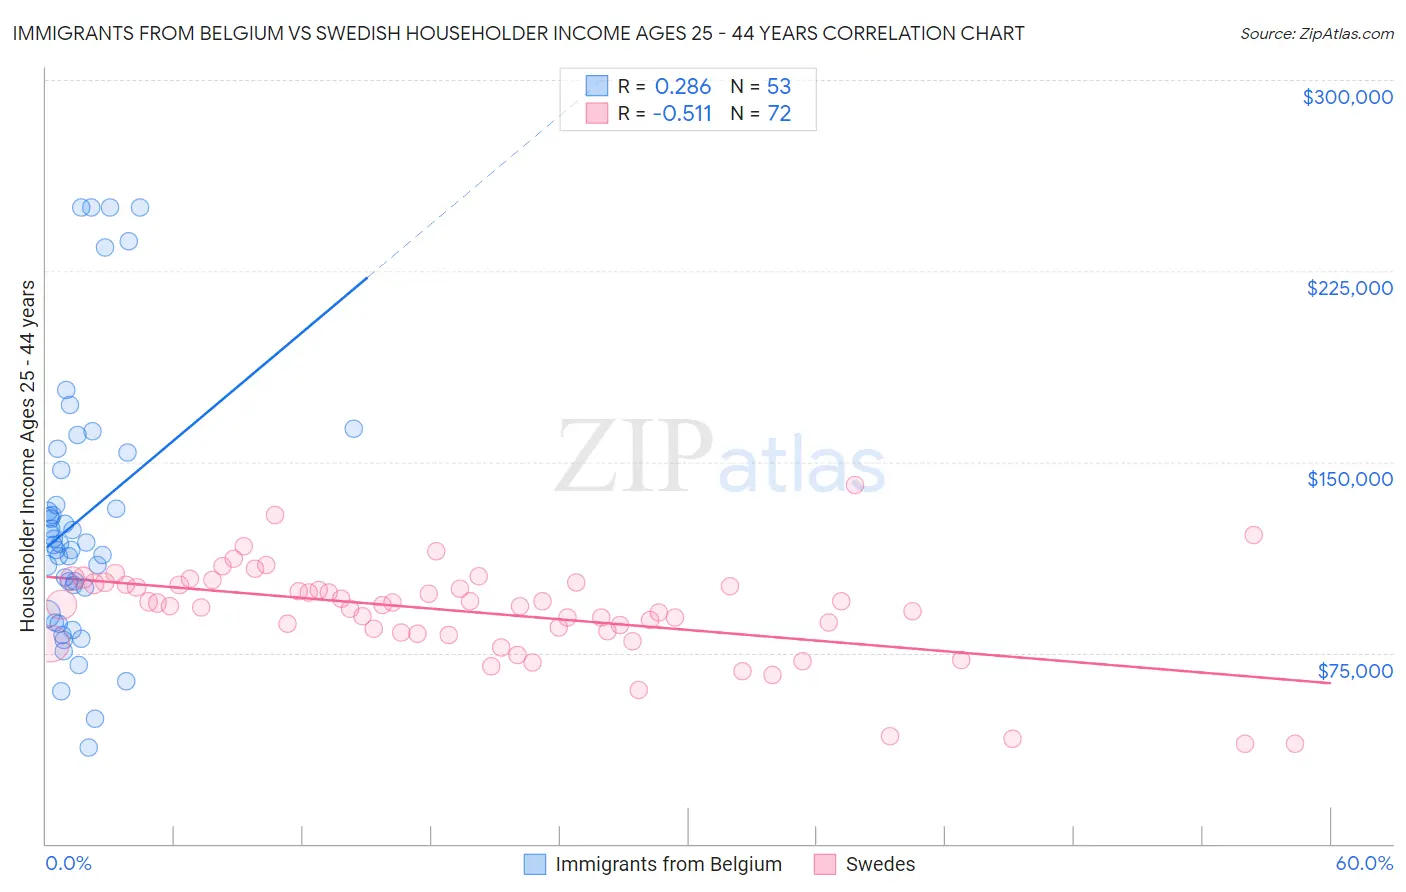
Immigrants from Belgium vs Swedish Householder Income Ages 25 - 44 years Correlation Chart
The statistical analysis conducted on geographies consisting of 146,567,695 people shows a weak positive correlation between the proportion of Immigrants from Belgium and household income with householder between the ages 25 and 44 in the United States with a correlation coefficient (R) of 0.286 and weighted average of $112,575. Similarly, the statistical analysis conducted on geographies consisting of 535,273,101 people shows a substantial negative correlation between the proportion of Swedes and household income with householder between the ages 25 and 44 in the United States with a correlation coefficient (R) of -0.511 and weighted average of $99,136, a difference of 13.6%.
Householder Income Ages 25 - 44 years Correlation Summary
| Measurement | Immigrants from Belgium | Swedish |
| Minimum | $37,722 | $39,167 |
| Maximum | $250,001 | $141,131 |
| Range | $212,279 | $101,964 |
| Mean | $127,529 | $91,056 |
| Median | $118,034 | $93,763 |
| Interquartile 25% (IQ1) | $95,583 | $83,282 |
| Interquartile 75% (IQ3) | $150,293 | $101,828 |
| Interquartile Range (IQR) | $54,710 | $18,546 |
| Standard Deviation (Sample) | $51,958 | $18,825 |
| Standard Deviation (Population) | $51,466 | $18,694 |
Similar Demographics by Householder Income Ages 25 - 44 years
Demographics Similar to Immigrants from Belgium by Householder Income Ages 25 - 44 years
In terms of householder income ages 25 - 44 years, the demographic groups most similar to Immigrants from Belgium are Asian ($112,666, a difference of 0.080%), Immigrants from Japan ($112,228, a difference of 0.31%), Immigrants from Sweden ($112,010, a difference of 0.50%), Immigrants from Korea ($113,401, a difference of 0.73%), and Immigrants from Northern Europe ($111,676, a difference of 0.80%).
| Demographics | Rating | Rank | Householder Income Ages 25 - 44 years |
| Immigrants | South Central Asia | 100.0 /100 | #15 | Exceptional $116,626 |
| Cypriots | 100.0 /100 | #16 | Exceptional $116,364 |
| Immigrants | Australia | 100.0 /100 | #17 | Exceptional $115,947 |
| Eastern Europeans | 100.0 /100 | #18 | Exceptional $114,523 |
| Burmese | 100.0 /100 | #19 | Exceptional $113,701 |
| Immigrants | Korea | 100.0 /100 | #20 | Exceptional $113,401 |
| Asians | 100.0 /100 | #21 | Exceptional $112,666 |
| Immigrants | Belgium | 100.0 /100 | #22 | Exceptional $112,575 |
| Immigrants | Japan | 100.0 /100 | #23 | Exceptional $112,228 |
| Immigrants | Sweden | 100.0 /100 | #24 | Exceptional $112,010 |
| Immigrants | Northern Europe | 100.0 /100 | #25 | Exceptional $111,676 |
| Immigrants | Asia | 100.0 /100 | #26 | Exceptional $110,787 |
| Russians | 100.0 /100 | #27 | Exceptional $110,398 |
| Immigrants | Denmark | 100.0 /100 | #28 | Exceptional $110,363 |
| Turks | 100.0 /100 | #29 | Exceptional $110,318 |
Demographics Similar to Swedes by Householder Income Ages 25 - 44 years
In terms of householder income ages 25 - 44 years, the demographic groups most similar to Swedes are Jordanian ($99,186, a difference of 0.050%), Syrian ($99,215, a difference of 0.080%), Immigrants from Northern Africa ($99,232, a difference of 0.10%), Peruvian ($98,886, a difference of 0.25%), and Portuguese ($99,429, a difference of 0.29%).
| Demographics | Rating | Rank | Householder Income Ages 25 - 44 years |
| Tongans | 94.2 /100 | #113 | Exceptional $99,604 |
| Immigrants | Western Asia | 94.0 /100 | #114 | Exceptional $99,516 |
| Carpatho Rusyns | 93.7 /100 | #115 | Exceptional $99,449 |
| Portuguese | 93.7 /100 | #116 | Exceptional $99,429 |
| Immigrants | Northern Africa | 93.0 /100 | #117 | Exceptional $99,232 |
| Syrians | 92.9 /100 | #118 | Exceptional $99,215 |
| Jordanians | 92.8 /100 | #119 | Exceptional $99,186 |
| Swedes | 92.7 /100 | #120 | Exceptional $99,136 |
| Peruvians | 91.7 /100 | #121 | Exceptional $98,886 |
| Immigrants | Uzbekistan | 91.5 /100 | #122 | Exceptional $98,849 |
| Palestinians | 91.2 /100 | #123 | Exceptional $98,777 |
| Zimbabweans | 90.3 /100 | #124 | Exceptional $98,586 |
| Pakistanis | 89.3 /100 | #125 | Excellent $98,401 |
| British | 89.1 /100 | #126 | Excellent $98,359 |
| Serbians | 88.9 /100 | #127 | Excellent $98,320 |