Immigrants from Belgium vs Slovene Householder Income Ages 25 - 44 years
COMPARE
Immigrants from Belgium
Slovene
Householder Income Ages 25 - 44 years
Householder Income Ages 25 - 44 years Comparison
Immigrants from Belgium
Slovenes
$112,575
HOUSEHOLDER INCOME AGES 25 - 44 YEARS
100.0/ 100
METRIC RATING
22nd/ 347
METRIC RANK
$96,439
HOUSEHOLDER INCOME AGES 25 - 44 YEARS
73.9/ 100
METRIC RATING
153rd/ 347
METRIC RANK
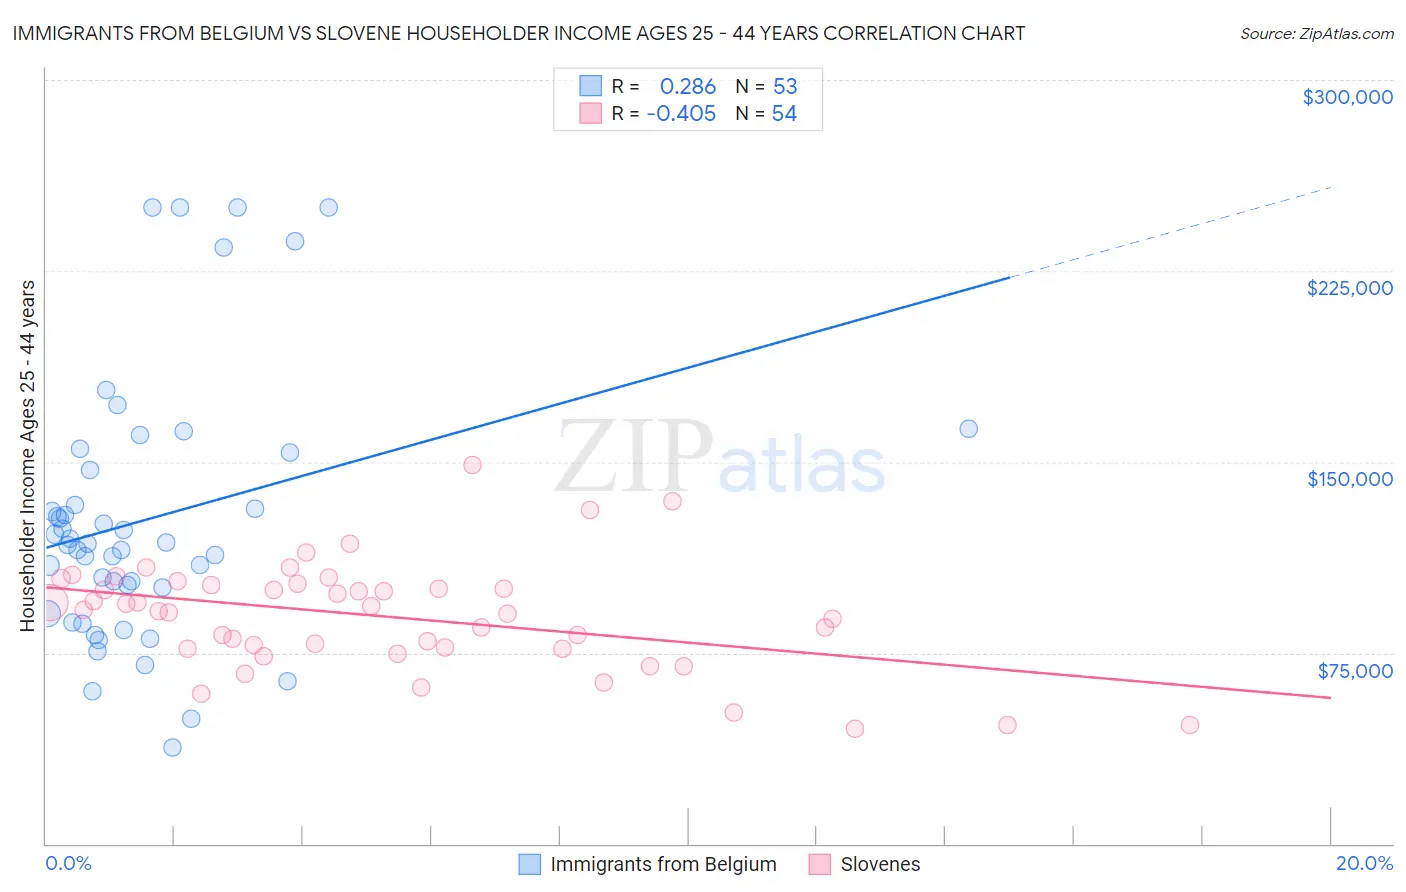
Immigrants from Belgium vs Slovene Householder Income Ages 25 - 44 years Correlation Chart
The statistical analysis conducted on geographies consisting of 146,567,695 people shows a weak positive correlation between the proportion of Immigrants from Belgium and household income with householder between the ages 25 and 44 in the United States with a correlation coefficient (R) of 0.286 and weighted average of $112,575. Similarly, the statistical analysis conducted on geographies consisting of 260,772,940 people shows a moderate negative correlation between the proportion of Slovenes and household income with householder between the ages 25 and 44 in the United States with a correlation coefficient (R) of -0.405 and weighted average of $96,439, a difference of 16.7%.
Householder Income Ages 25 - 44 years Correlation Summary
| Measurement | Immigrants from Belgium | Slovene |
| Minimum | $37,722 | $45,114 |
| Maximum | $250,001 | $149,005 |
| Range | $212,279 | $103,891 |
| Mean | $127,529 | $89,263 |
| Median | $118,034 | $91,712 |
| Interquartile 25% (IQ1) | $95,583 | $76,661 |
| Interquartile 75% (IQ3) | $150,293 | $101,430 |
| Interquartile Range (IQR) | $54,710 | $24,769 |
| Standard Deviation (Sample) | $51,958 | $21,285 |
| Standard Deviation (Population) | $51,466 | $21,087 |
Similar Demographics by Householder Income Ages 25 - 44 years
Demographics Similar to Immigrants from Belgium by Householder Income Ages 25 - 44 years
In terms of householder income ages 25 - 44 years, the demographic groups most similar to Immigrants from Belgium are Asian ($112,666, a difference of 0.080%), Immigrants from Japan ($112,228, a difference of 0.31%), Immigrants from Sweden ($112,010, a difference of 0.50%), Immigrants from Korea ($113,401, a difference of 0.73%), and Immigrants from Northern Europe ($111,676, a difference of 0.80%).
| Demographics | Rating | Rank | Householder Income Ages 25 - 44 years |
| Immigrants | South Central Asia | 100.0 /100 | #15 | Exceptional $116,626 |
| Cypriots | 100.0 /100 | #16 | Exceptional $116,364 |
| Immigrants | Australia | 100.0 /100 | #17 | Exceptional $115,947 |
| Eastern Europeans | 100.0 /100 | #18 | Exceptional $114,523 |
| Burmese | 100.0 /100 | #19 | Exceptional $113,701 |
| Immigrants | Korea | 100.0 /100 | #20 | Exceptional $113,401 |
| Asians | 100.0 /100 | #21 | Exceptional $112,666 |
| Immigrants | Belgium | 100.0 /100 | #22 | Exceptional $112,575 |
| Immigrants | Japan | 100.0 /100 | #23 | Exceptional $112,228 |
| Immigrants | Sweden | 100.0 /100 | #24 | Exceptional $112,010 |
| Immigrants | Northern Europe | 100.0 /100 | #25 | Exceptional $111,676 |
| Immigrants | Asia | 100.0 /100 | #26 | Exceptional $110,787 |
| Russians | 100.0 /100 | #27 | Exceptional $110,398 |
| Immigrants | Denmark | 100.0 /100 | #28 | Exceptional $110,363 |
| Turks | 100.0 /100 | #29 | Exceptional $110,318 |
Demographics Similar to Slovenes by Householder Income Ages 25 - 44 years
In terms of householder income ages 25 - 44 years, the demographic groups most similar to Slovenes are South American Indian ($96,497, a difference of 0.060%), Slavic ($96,377, a difference of 0.060%), Czech ($96,525, a difference of 0.090%), Ugandan ($96,667, a difference of 0.24%), and Basque ($96,709, a difference of 0.28%).
| Demographics | Rating | Rank | Householder Income Ages 25 - 44 years |
| Ethiopians | 77.8 /100 | #146 | Good $96,824 |
| Immigrants | Syria | 77.4 /100 | #147 | Good $96,789 |
| Irish | 76.9 /100 | #148 | Good $96,730 |
| Basques | 76.6 /100 | #149 | Good $96,709 |
| Ugandans | 76.2 /100 | #150 | Good $96,667 |
| Czechs | 74.8 /100 | #151 | Good $96,525 |
| South American Indians | 74.5 /100 | #152 | Good $96,497 |
| Slovenes | 73.9 /100 | #153 | Good $96,439 |
| Slavs | 73.2 /100 | #154 | Good $96,377 |
| Moroccans | 70.3 /100 | #155 | Good $96,117 |
| Immigrants | Germany | 67.9 /100 | #156 | Good $95,913 |
| Immigrants | Uganda | 65.2 /100 | #157 | Good $95,698 |
| Scandinavians | 63.9 /100 | #158 | Good $95,596 |
| Costa Ricans | 63.5 /100 | #159 | Good $95,565 |
| Icelanders | 63.4 /100 | #160 | Good $95,560 |