Immigrants from Denmark vs Guatemalan Median Female Earnings
COMPARE
Immigrants from Denmark
Guatemalan
Median Female Earnings
Median Female Earnings Comparison
Immigrants from Denmark
Guatemalans
$43,646
MEDIAN FEMALE EARNINGS
100.0/ 100
METRIC RATING
42nd/ 347
METRIC RANK
$35,695
MEDIAN FEMALE EARNINGS
0.0/ 100
METRIC RATING
293rd/ 347
METRIC RANK
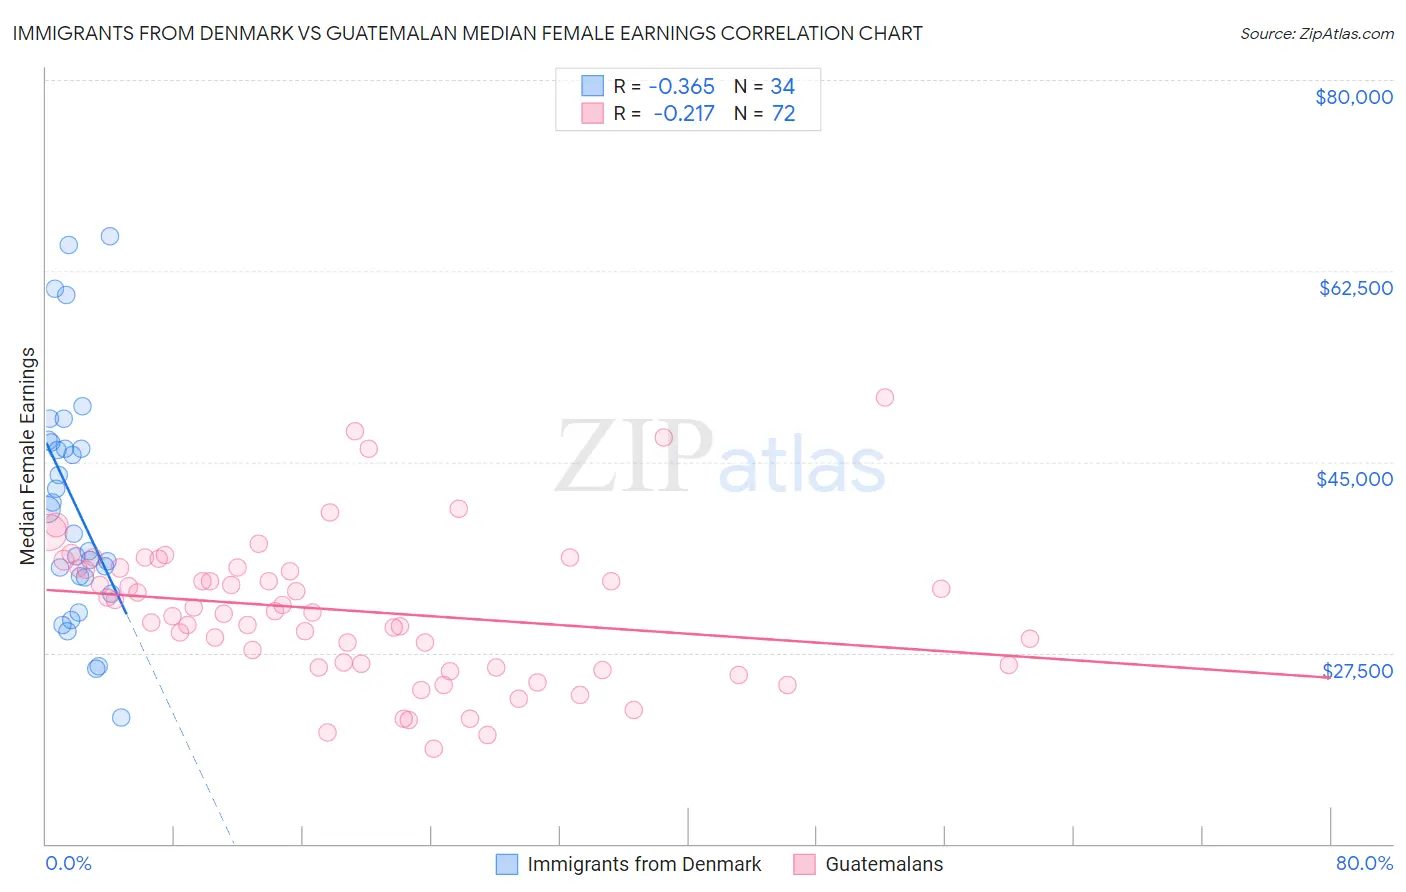
Immigrants from Denmark vs Guatemalan Median Female Earnings Correlation Chart
The statistical analysis conducted on geographies consisting of 136,407,509 people shows a mild negative correlation between the proportion of Immigrants from Denmark and median female earnings in the United States with a correlation coefficient (R) of -0.365 and weighted average of $43,646. Similarly, the statistical analysis conducted on geographies consisting of 409,414,975 people shows a weak negative correlation between the proportion of Guatemalans and median female earnings in the United States with a correlation coefficient (R) of -0.217 and weighted average of $35,695, a difference of 22.3%.
Median Female Earnings Correlation Summary
| Measurement | Immigrants from Denmark | Guatemalan |
| Minimum | $21,591 | $18,750 |
| Maximum | $65,662 | $50,917 |
| Range | $44,071 | $32,167 |
| Mean | $41,084 | $31,367 |
| Median | $39,517 | $31,263 |
| Interquartile 25% (IQ1) | $34,414 | $26,284 |
| Interquartile 75% (IQ3) | $46,746 | $35,245 |
| Interquartile Range (IQR) | $12,332 | $8,961 |
| Standard Deviation (Sample) | $10,895 | $6,641 |
| Standard Deviation (Population) | $10,734 | $6,594 |
Similar Demographics by Median Female Earnings
Demographics Similar to Immigrants from Denmark by Median Female Earnings
In terms of median female earnings, the demographic groups most similar to Immigrants from Denmark are Bhutanese ($43,648, a difference of 0.0%), Bulgarian ($43,638, a difference of 0.020%), Immigrants from Czechoslovakia ($43,571, a difference of 0.17%), Immigrants from Europe ($43,523, a difference of 0.28%), and Immigrants from Bolivia ($43,467, a difference of 0.41%).
| Demographics | Rating | Rank | Median Female Earnings |
| Immigrants | Sri Lanka | 100.0 /100 | #35 | Exceptional $44,161 |
| Immigrants | Turkey | 100.0 /100 | #36 | Exceptional $44,066 |
| Immigrants | Switzerland | 100.0 /100 | #37 | Exceptional $43,996 |
| Latvians | 100.0 /100 | #38 | Exceptional $43,941 |
| Israelis | 100.0 /100 | #39 | Exceptional $43,852 |
| Immigrants | Malaysia | 100.0 /100 | #40 | Exceptional $43,835 |
| Bhutanese | 100.0 /100 | #41 | Exceptional $43,648 |
| Immigrants | Denmark | 100.0 /100 | #42 | Exceptional $43,646 |
| Bulgarians | 100.0 /100 | #43 | Exceptional $43,638 |
| Immigrants | Czechoslovakia | 100.0 /100 | #44 | Exceptional $43,571 |
| Immigrants | Europe | 100.0 /100 | #45 | Exceptional $43,523 |
| Immigrants | Bolivia | 100.0 /100 | #46 | Exceptional $43,467 |
| Bolivians | 100.0 /100 | #47 | Exceptional $43,445 |
| Immigrants | Indonesia | 100.0 /100 | #48 | Exceptional $43,412 |
| Immigrants | Serbia | 100.0 /100 | #49 | Exceptional $43,385 |
Demographics Similar to Guatemalans by Median Female Earnings
In terms of median female earnings, the demographic groups most similar to Guatemalans are Cheyenne ($35,673, a difference of 0.060%), Comanche ($35,661, a difference of 0.090%), Mexican American Indian ($35,629, a difference of 0.19%), American ($35,777, a difference of 0.23%), and Blackfeet ($35,864, a difference of 0.47%).
| Demographics | Rating | Rank | Median Female Earnings |
| Osage | 0.0 /100 | #286 | Tragic $36,034 |
| Immigrants | Nicaragua | 0.0 /100 | #287 | Tragic $36,023 |
| Immigrants | Zaire | 0.0 /100 | #288 | Tragic $36,017 |
| Bangladeshis | 0.0 /100 | #289 | Tragic $35,960 |
| Central American Indians | 0.0 /100 | #290 | Tragic $35,930 |
| Blackfeet | 0.0 /100 | #291 | Tragic $35,864 |
| Americans | 0.0 /100 | #292 | Tragic $35,777 |
| Guatemalans | 0.0 /100 | #293 | Tragic $35,695 |
| Cheyenne | 0.0 /100 | #294 | Tragic $35,673 |
| Comanche | 0.0 /100 | #295 | Tragic $35,661 |
| Mexican American Indians | 0.0 /100 | #296 | Tragic $35,629 |
| Hmong | 0.0 /100 | #297 | Tragic $35,498 |
| Immigrants | Micronesia | 0.0 /100 | #298 | Tragic $35,477 |
| Immigrants | Guatemala | 0.0 /100 | #299 | Tragic $35,444 |
| Yuman | 0.0 /100 | #300 | Tragic $35,377 |