Immigrants from Armenia vs Icelander Householder Income Ages 25 - 44 years
COMPARE
Immigrants from Armenia
Icelander
Householder Income Ages 25 - 44 years
Householder Income Ages 25 - 44 years Comparison
Immigrants from Armenia
Icelanders
$94,867
HOUSEHOLDER INCOME AGES 25 - 44 YEARS
54.2/ 100
METRIC RATING
171st/ 347
METRIC RANK
$95,560
HOUSEHOLDER INCOME AGES 25 - 44 YEARS
63.4/ 100
METRIC RATING
160th/ 347
METRIC RANK
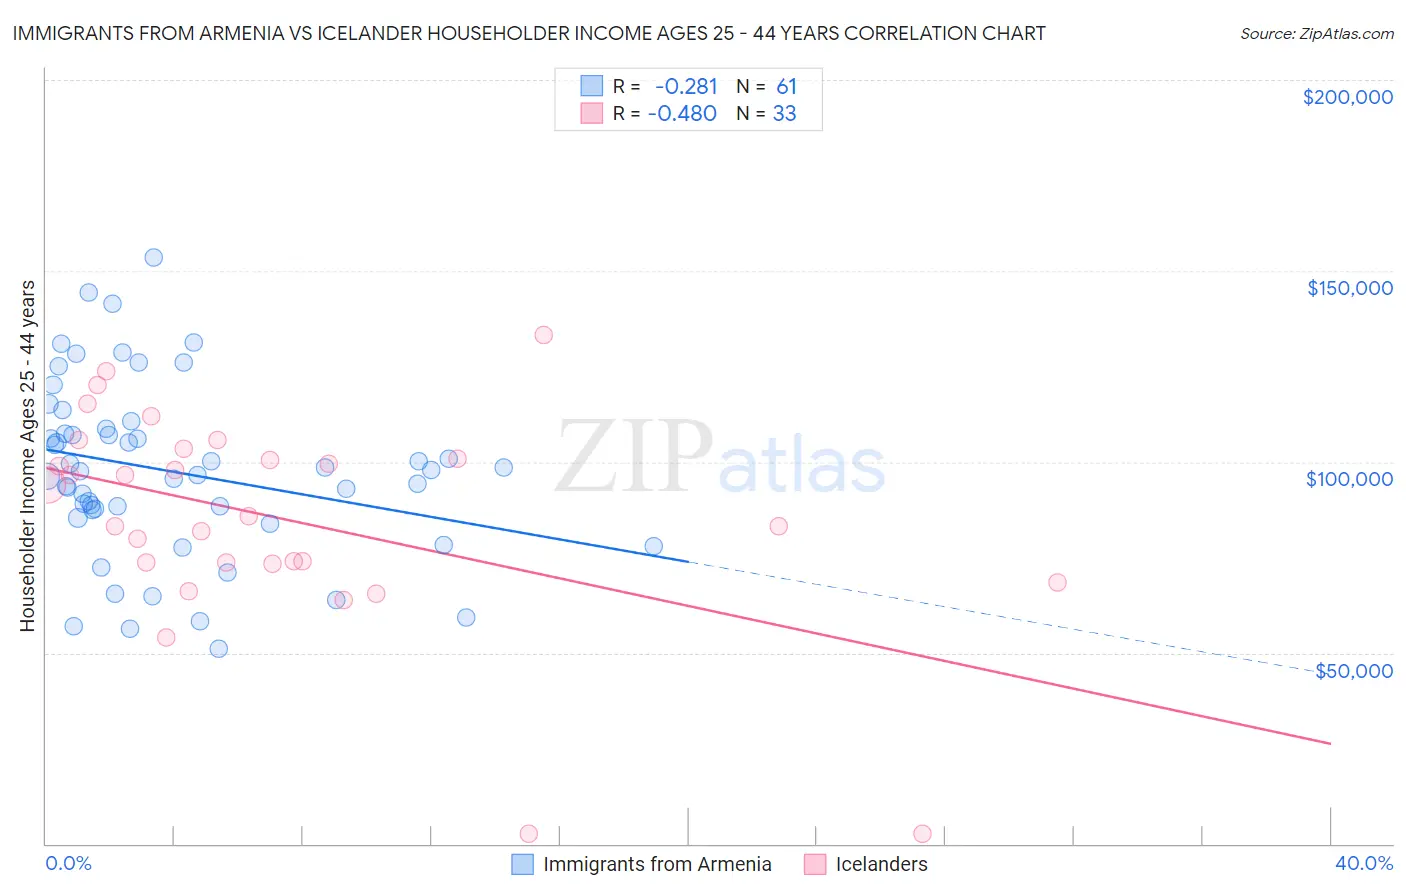
Immigrants from Armenia vs Icelander Householder Income Ages 25 - 44 years Correlation Chart
The statistical analysis conducted on geographies consisting of 97,704,763 people shows a weak negative correlation between the proportion of Immigrants from Armenia and household income with householder between the ages 25 and 44 in the United States with a correlation coefficient (R) of -0.281 and weighted average of $94,867. Similarly, the statistical analysis conducted on geographies consisting of 159,415,767 people shows a moderate negative correlation between the proportion of Icelanders and household income with householder between the ages 25 and 44 in the United States with a correlation coefficient (R) of -0.480 and weighted average of $95,560, a difference of 0.73%.
Householder Income Ages 25 - 44 years Correlation Summary
| Measurement | Immigrants from Armenia | Icelander |
| Minimum | $50,938 | $2,499 |
| Maximum | $153,486 | $133,125 |
| Range | $102,548 | $130,626 |
| Mean | $97,387 | $85,123 |
| Median | $97,643 | $85,831 |
| Interquartile 25% (IQ1) | $86,360 | $73,462 |
| Interquartile 75% (IQ3) | $108,002 | $102,113 |
| Interquartile Range (IQR) | $21,642 | $28,651 |
| Standard Deviation (Sample) | $22,751 | $28,508 |
| Standard Deviation (Population) | $22,564 | $28,072 |
Demographics Similar to Immigrants from Armenia and Icelanders by Householder Income Ages 25 - 44 years
In terms of householder income ages 25 - 44 years, the demographic groups most similar to Immigrants from Armenia are Slovak ($95,032, a difference of 0.17%), Alsatian ($95,059, a difference of 0.20%), Native Hawaiian ($95,058, a difference of 0.20%), Czechoslovakian ($95,070, a difference of 0.21%), and Scottish ($94,622, a difference of 0.26%). Similarly, the demographic groups most similar to Icelanders are Costa Rican ($95,565, a difference of 0.010%), Scandinavian ($95,596, a difference of 0.040%), Immigrants from Portugal ($95,512, a difference of 0.050%), Swiss ($95,511, a difference of 0.050%), and Immigrants from Saudi Arabia ($95,450, a difference of 0.11%).
| Demographics | Rating | Rank | Householder Income Ages 25 - 44 years |
| Moroccans | 70.3 /100 | #155 | Good $96,117 |
| Immigrants | Germany | 67.9 /100 | #156 | Good $95,913 |
| Immigrants | Uganda | 65.2 /100 | #157 | Good $95,698 |
| Scandinavians | 63.9 /100 | #158 | Good $95,596 |
| Costa Ricans | 63.5 /100 | #159 | Good $95,565 |
| Icelanders | 63.4 /100 | #160 | Good $95,560 |
| Immigrants | Portugal | 62.8 /100 | #161 | Good $95,512 |
| Swiss | 62.8 /100 | #162 | Good $95,511 |
| Immigrants | Saudi Arabia | 62.0 /100 | #163 | Good $95,450 |
| South Americans | 60.9 /100 | #164 | Good $95,362 |
| Immigrants | Nepal | 60.3 /100 | #165 | Good $95,322 |
| Immigrants | Ethiopia | 59.5 /100 | #166 | Average $95,256 |
| Czechoslovakians | 57.0 /100 | #167 | Average $95,070 |
| Alsatians | 56.8 /100 | #168 | Average $95,059 |
| Native Hawaiians | 56.8 /100 | #169 | Average $95,058 |
| Slovaks | 56.4 /100 | #170 | Average $95,032 |
| Immigrants | Armenia | 54.2 /100 | #171 | Average $94,867 |
| Scottish | 50.8 /100 | #172 | Average $94,622 |
| Finns | 50.6 /100 | #173 | Average $94,610 |
| Colombians | 50.0 /100 | #174 | Average $94,565 |
| English | 48.1 /100 | #175 | Average $94,429 |