Immigrants from Barbados vs Immigrants from Indonesia Householder Income Ages 45 - 64 years
COMPARE
Immigrants from Barbados
Immigrants from Indonesia
Householder Income Ages 45 - 64 years
Householder Income Ages 45 - 64 years Comparison
Immigrants from Barbados
Immigrants from Indonesia
$89,394
HOUSEHOLDER INCOME AGES 45 - 64 YEARS
0.4/ 100
METRIC RATING
258th/ 347
METRIC RANK
$113,519
HOUSEHOLDER INCOME AGES 45 - 64 YEARS
99.9/ 100
METRIC RATING
48th/ 347
METRIC RANK
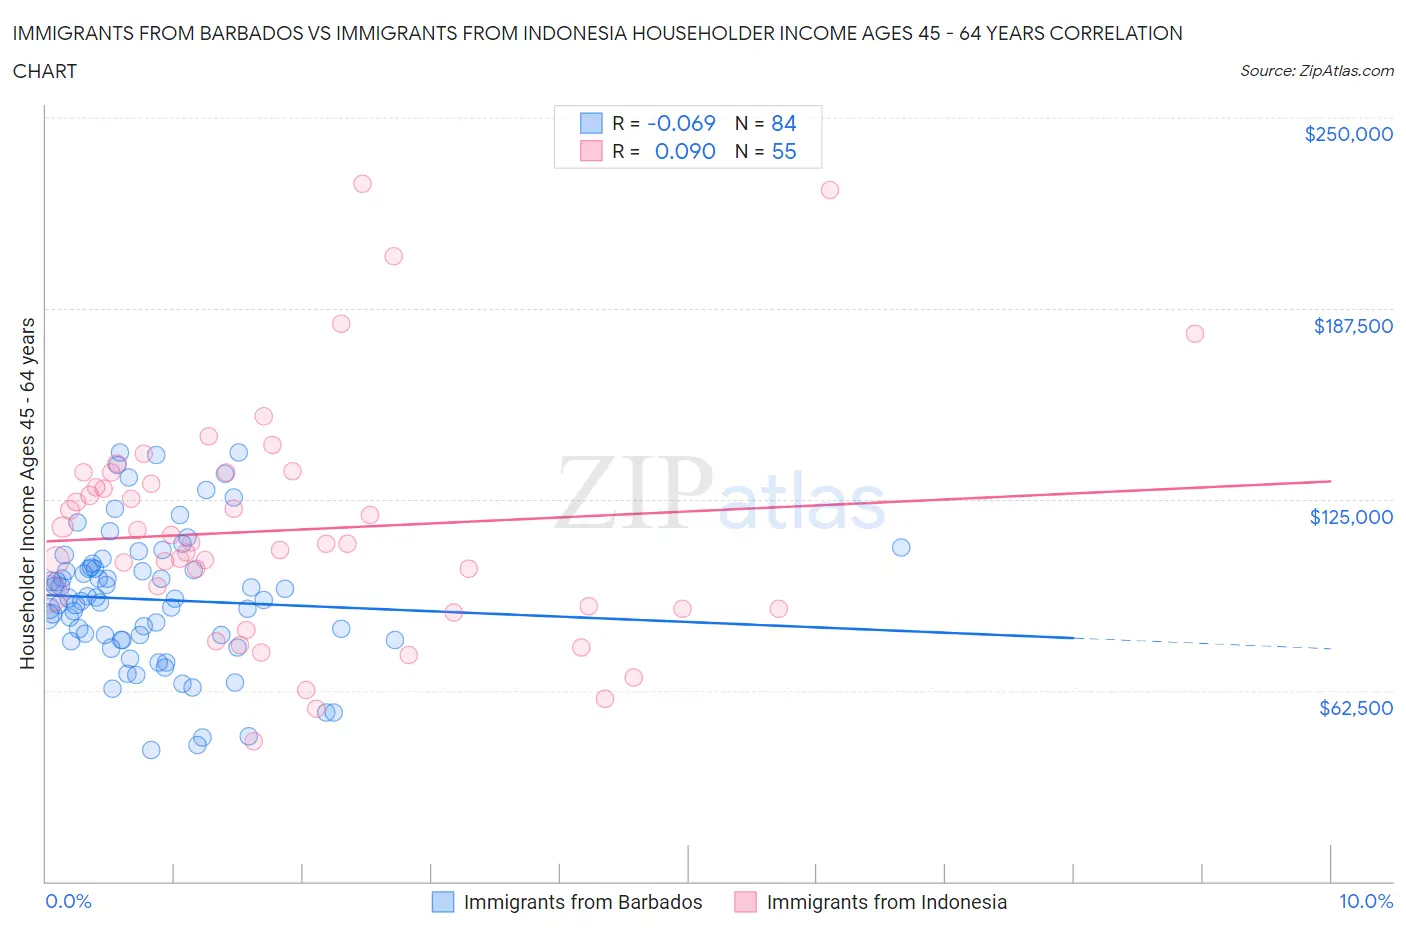
Immigrants from Barbados vs Immigrants from Indonesia Householder Income Ages 45 - 64 years Correlation Chart
The statistical analysis conducted on geographies consisting of 112,734,331 people shows a slight negative correlation between the proportion of Immigrants from Barbados and household income with householder between the ages 45 and 64 in the United States with a correlation coefficient (R) of -0.069 and weighted average of $89,394. Similarly, the statistical analysis conducted on geographies consisting of 215,592,111 people shows a slight positive correlation between the proportion of Immigrants from Indonesia and household income with householder between the ages 45 and 64 in the United States with a correlation coefficient (R) of 0.090 and weighted average of $113,519, a difference of 27.0%.
Householder Income Ages 45 - 64 years Correlation Summary
| Measurement | Immigrants from Barbados | Immigrants from Indonesia |
| Minimum | $42,917 | $45,964 |
| Maximum | $140,429 | $228,214 |
| Range | $97,512 | $182,250 |
| Mean | $92,160 | $114,986 |
| Median | $92,269 | $110,532 |
| Interquartile 25% (IQ1) | $79,098 | $89,063 |
| Interquartile 75% (IQ3) | $102,596 | $133,651 |
| Interquartile Range (IQR) | $23,498 | $44,588 |
| Standard Deviation (Sample) | $21,991 | $37,980 |
| Standard Deviation (Population) | $21,860 | $37,633 |
Similar Demographics by Householder Income Ages 45 - 64 years
Demographics Similar to Immigrants from Barbados by Householder Income Ages 45 - 64 years
In terms of householder income ages 45 - 64 years, the demographic groups most similar to Immigrants from Barbados are German Russian ($89,398, a difference of 0.0%), Immigrants from Nicaragua ($89,108, a difference of 0.32%), French American Indian ($89,811, a difference of 0.47%), Liberian ($88,929, a difference of 0.52%), and West Indian ($89,906, a difference of 0.57%).
| Demographics | Rating | Rank | Householder Income Ages 45 - 64 years |
| Americans | 0.7 /100 | #251 | Tragic $90,536 |
| Marshallese | 0.7 /100 | #252 | Tragic $90,455 |
| Barbadians | 0.6 /100 | #253 | Tragic $90,266 |
| Immigrants | Guyana | 0.6 /100 | #254 | Tragic $90,186 |
| West Indians | 0.5 /100 | #255 | Tragic $89,906 |
| French American Indians | 0.5 /100 | #256 | Tragic $89,811 |
| German Russians | 0.4 /100 | #257 | Tragic $89,398 |
| Immigrants | Barbados | 0.4 /100 | #258 | Tragic $89,394 |
| Immigrants | Nicaragua | 0.4 /100 | #259 | Tragic $89,108 |
| Liberians | 0.3 /100 | #260 | Tragic $88,929 |
| Belizeans | 0.3 /100 | #261 | Tragic $88,684 |
| Somalis | 0.3 /100 | #262 | Tragic $88,600 |
| Immigrants | Senegal | 0.3 /100 | #263 | Tragic $88,421 |
| Osage | 0.3 /100 | #264 | Tragic $88,390 |
| Jamaicans | 0.2 /100 | #265 | Tragic $88,327 |
Demographics Similar to Immigrants from Indonesia by Householder Income Ages 45 - 64 years
In terms of householder income ages 45 - 64 years, the demographic groups most similar to Immigrants from Indonesia are Australian ($113,533, a difference of 0.010%), Immigrants from Greece ($113,548, a difference of 0.030%), Immigrants from France ($113,680, a difference of 0.14%), Immigrants from Russia ($113,215, a difference of 0.27%), and Bulgarian ($113,883, a difference of 0.32%).
| Demographics | Rating | Rank | Householder Income Ages 45 - 64 years |
| Immigrants | Lithuania | 99.9 /100 | #41 | Exceptional $114,336 |
| Estonians | 99.9 /100 | #42 | Exceptional $114,220 |
| Israelis | 99.9 /100 | #43 | Exceptional $114,186 |
| Bulgarians | 99.9 /100 | #44 | Exceptional $113,883 |
| Immigrants | France | 99.9 /100 | #45 | Exceptional $113,680 |
| Immigrants | Greece | 99.9 /100 | #46 | Exceptional $113,548 |
| Australians | 99.9 /100 | #47 | Exceptional $113,533 |
| Immigrants | Indonesia | 99.9 /100 | #48 | Exceptional $113,519 |
| Immigrants | Russia | 99.8 /100 | #49 | Exceptional $113,215 |
| Immigrants | Austria | 99.8 /100 | #50 | Exceptional $113,140 |
| Immigrants | South Africa | 99.8 /100 | #51 | Exceptional $112,886 |
| Immigrants | Malaysia | 99.8 /100 | #52 | Exceptional $112,796 |
| Afghans | 99.8 /100 | #53 | Exceptional $112,676 |
| Greeks | 99.8 /100 | #54 | Exceptional $112,630 |
| Lithuanians | 99.8 /100 | #55 | Exceptional $112,484 |