Immigrants from Afghanistan vs Immigrants from Czechoslovakia Householder Income Ages 45 - 64 years
COMPARE
Immigrants from Afghanistan
Immigrants from Czechoslovakia
Householder Income Ages 45 - 64 years
Householder Income Ages 45 - 64 years Comparison
Immigrants from Afghanistan
Immigrants from Czechoslovakia
$108,785
HOUSEHOLDER INCOME AGES 45 - 64 YEARS
98.6/ 100
METRIC RATING
85th/ 347
METRIC RANK
$111,914
HOUSEHOLDER INCOME AGES 45 - 64 YEARS
99.7/ 100
METRIC RATING
61st/ 347
METRIC RANK
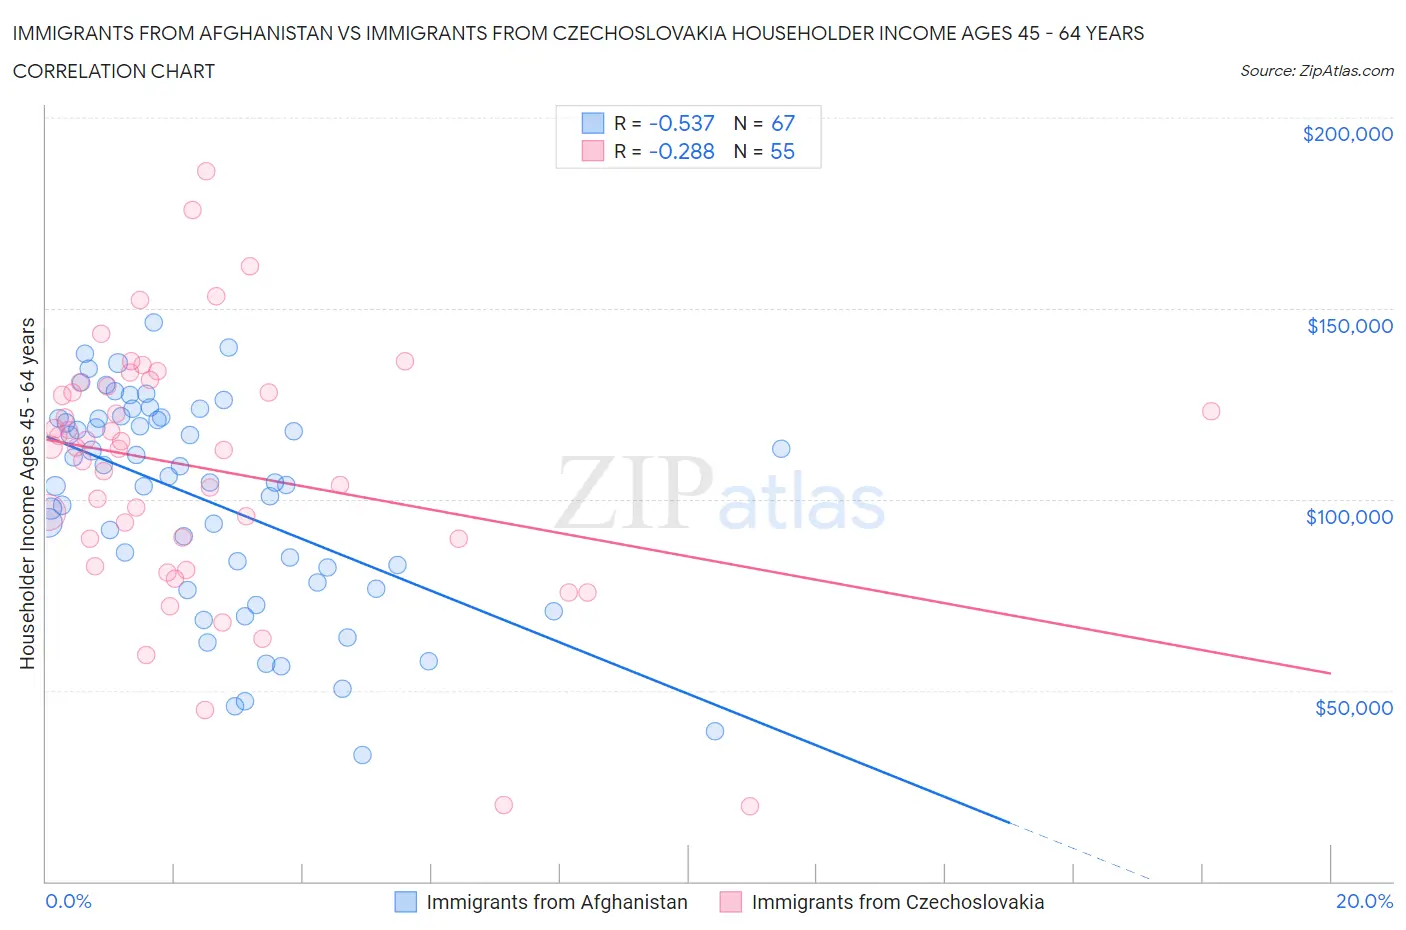
Immigrants from Afghanistan vs Immigrants from Czechoslovakia Householder Income Ages 45 - 64 years Correlation Chart
The statistical analysis conducted on geographies consisting of 147,616,456 people shows a substantial negative correlation between the proportion of Immigrants from Afghanistan and household income with householder between the ages 45 and 64 in the United States with a correlation coefficient (R) of -0.537 and weighted average of $108,785. Similarly, the statistical analysis conducted on geographies consisting of 195,371,868 people shows a weak negative correlation between the proportion of Immigrants from Czechoslovakia and household income with householder between the ages 45 and 64 in the United States with a correlation coefficient (R) of -0.288 and weighted average of $111,914, a difference of 2.9%.
Householder Income Ages 45 - 64 years Correlation Summary
| Measurement | Immigrants from Afghanistan | Immigrants from Czechoslovakia |
| Minimum | $33,125 | $19,531 |
| Maximum | $146,322 | $185,944 |
| Range | $113,197 | $166,413 |
| Mean | $99,596 | $108,047 |
| Median | $104,498 | $113,601 |
| Interquartile 25% (IQ1) | $78,229 | $89,542 |
| Interquartile 75% (IQ3) | $121,219 | $129,527 |
| Interquartile Range (IQR) | $42,990 | $39,985 |
| Standard Deviation (Sample) | $27,771 | $33,291 |
| Standard Deviation (Population) | $27,563 | $32,987 |
Similar Demographics by Householder Income Ages 45 - 64 years
Demographics Similar to Immigrants from Afghanistan by Householder Income Ages 45 - 64 years
In terms of householder income ages 45 - 64 years, the demographic groups most similar to Immigrants from Afghanistan are Immigrants from Western Europe ($108,824, a difference of 0.040%), Austrian ($108,692, a difference of 0.090%), Tongan ($108,643, a difference of 0.13%), Romanian ($108,609, a difference of 0.16%), and Immigrants from Spain ($109,051, a difference of 0.24%).
| Demographics | Rating | Rank | Householder Income Ages 45 - 64 years |
| Immigrants | Canada | 99.0 /100 | #78 | Exceptional $109,402 |
| Immigrants | Bulgaria | 98.9 /100 | #79 | Exceptional $109,379 |
| Jordanians | 98.9 /100 | #80 | Exceptional $109,376 |
| Immigrants | Eastern Europe | 98.9 /100 | #81 | Exceptional $109,335 |
| Immigrants | North America | 98.8 /100 | #82 | Exceptional $109,198 |
| Immigrants | Spain | 98.8 /100 | #83 | Exceptional $109,051 |
| Immigrants | Western Europe | 98.6 /100 | #84 | Exceptional $108,824 |
| Immigrants | Afghanistan | 98.6 /100 | #85 | Exceptional $108,785 |
| Austrians | 98.5 /100 | #86 | Exceptional $108,692 |
| Tongans | 98.5 /100 | #87 | Exceptional $108,643 |
| Romanians | 98.5 /100 | #88 | Exceptional $108,609 |
| Ukrainians | 98.3 /100 | #89 | Exceptional $108,475 |
| Immigrants | Philippines | 98.3 /100 | #90 | Exceptional $108,471 |
| Immigrants | Lebanon | 98.3 /100 | #91 | Exceptional $108,471 |
| Croatians | 98.3 /100 | #92 | Exceptional $108,383 |
Demographics Similar to Immigrants from Czechoslovakia by Householder Income Ages 45 - 64 years
In terms of householder income ages 45 - 64 years, the demographic groups most similar to Immigrants from Czechoslovakia are Immigrants from Europe ($111,984, a difference of 0.060%), Immigrants from Netherlands ($111,982, a difference of 0.060%), Soviet Union ($112,008, a difference of 0.080%), Immigrants from Norway ($111,669, a difference of 0.22%), and Immigrants from Scotland ($112,175, a difference of 0.23%).
| Demographics | Rating | Rank | Householder Income Ages 45 - 64 years |
| Greeks | 99.8 /100 | #54 | Exceptional $112,630 |
| Lithuanians | 99.8 /100 | #55 | Exceptional $112,484 |
| Egyptians | 99.7 /100 | #56 | Exceptional $112,256 |
| Immigrants | Scotland | 99.7 /100 | #57 | Exceptional $112,175 |
| Soviet Union | 99.7 /100 | #58 | Exceptional $112,008 |
| Immigrants | Europe | 99.7 /100 | #59 | Exceptional $111,984 |
| Immigrants | Netherlands | 99.7 /100 | #60 | Exceptional $111,982 |
| Immigrants | Czechoslovakia | 99.7 /100 | #61 | Exceptional $111,914 |
| Immigrants | Norway | 99.7 /100 | #62 | Exceptional $111,669 |
| Mongolians | 99.6 /100 | #63 | Exceptional $111,602 |
| Immigrants | Latvia | 99.6 /100 | #64 | Exceptional $111,454 |
| Immigrants | Belarus | 99.6 /100 | #65 | Exceptional $111,430 |
| New Zealanders | 99.6 /100 | #66 | Exceptional $111,286 |
| Laotians | 99.5 /100 | #67 | Exceptional $111,051 |
| Immigrants | Romania | 99.4 /100 | #68 | Exceptional $110,633 |