Immigrants from Canada vs Tohono O'odham Median Earnings
COMPARE
Immigrants from Canada
Tohono O'odham
Median Earnings
Median Earnings Comparison
Immigrants from Canada
Tohono O'odham
$50,192
MEDIAN EARNINGS
99.5/ 100
METRIC RATING
86th/ 347
METRIC RANK
$36,349
MEDIAN EARNINGS
0.0/ 100
METRIC RATING
345th/ 347
METRIC RANK
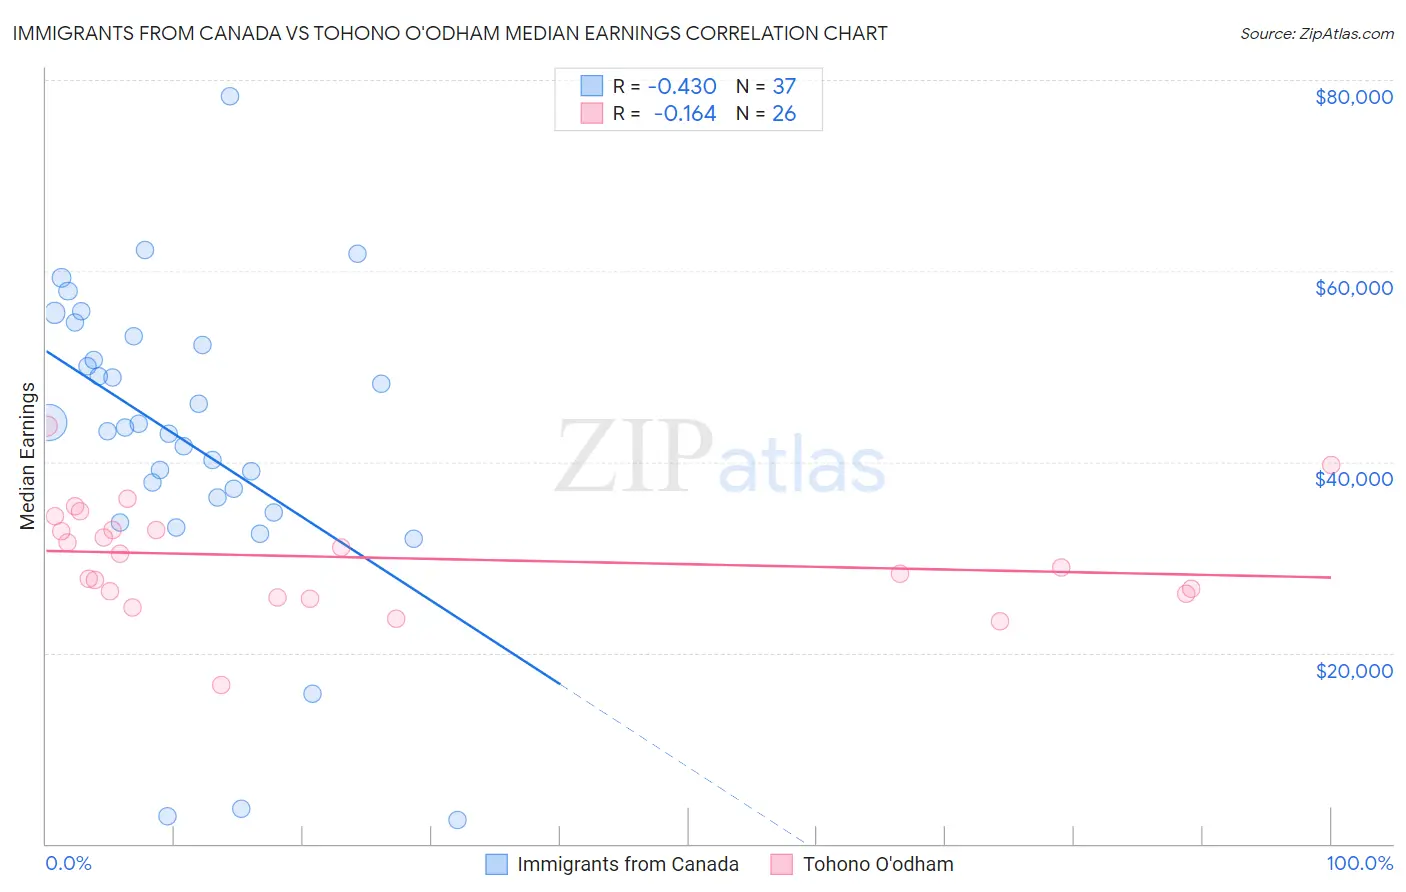
Immigrants from Canada vs Tohono O'odham Median Earnings Correlation Chart
The statistical analysis conducted on geographies consisting of 459,326,577 people shows a moderate negative correlation between the proportion of Immigrants from Canada and median earnings in the United States with a correlation coefficient (R) of -0.430 and weighted average of $50,192. Similarly, the statistical analysis conducted on geographies consisting of 58,728,293 people shows a poor negative correlation between the proportion of Tohono O'odham and median earnings in the United States with a correlation coefficient (R) of -0.164 and weighted average of $36,349, a difference of 38.1%.
Median Earnings Correlation Summary
| Measurement | Immigrants from Canada | Tohono O'odham |
| Minimum | $2,499 | $16,641 |
| Maximum | $78,310 | $43,705 |
| Range | $75,811 | $27,064 |
| Mean | $42,254 | $29,971 |
| Median | $43,536 | $29,707 |
| Interquartile 25% (IQ1) | $35,442 | $26,250 |
| Interquartile 75% (IQ3) | $52,692 | $32,909 |
| Interquartile Range (IQR) | $17,250 | $6,659 |
| Standard Deviation (Sample) | $16,214 | $5,663 |
| Standard Deviation (Population) | $15,993 | $5,553 |
Similar Demographics by Median Earnings
Demographics Similar to Immigrants from Canada by Median Earnings
In terms of median earnings, the demographic groups most similar to Immigrants from Canada are Immigrants from Hungary ($50,227, a difference of 0.070%), Immigrants from Kazakhstan ($50,225, a difference of 0.070%), Immigrants from Uzbekistan ($50,151, a difference of 0.080%), Romanian ($50,244, a difference of 0.10%), and Albanian ($50,116, a difference of 0.15%).
| Demographics | Rating | Rank | Median Earnings |
| Laotians | 99.6 /100 | #79 | Exceptional $50,343 |
| Ukrainians | 99.6 /100 | #80 | Exceptional $50,320 |
| Immigrants | Southern Europe | 99.6 /100 | #81 | Exceptional $50,280 |
| Immigrants | Moldova | 99.5 /100 | #82 | Exceptional $50,274 |
| Romanians | 99.5 /100 | #83 | Exceptional $50,244 |
| Immigrants | Hungary | 99.5 /100 | #84 | Exceptional $50,227 |
| Immigrants | Kazakhstan | 99.5 /100 | #85 | Exceptional $50,225 |
| Immigrants | Canada | 99.5 /100 | #86 | Exceptional $50,192 |
| Immigrants | Uzbekistan | 99.5 /100 | #87 | Exceptional $50,151 |
| Albanians | 99.4 /100 | #88 | Exceptional $50,116 |
| Immigrants | North America | 99.4 /100 | #89 | Exceptional $50,108 |
| Italians | 99.3 /100 | #90 | Exceptional $49,915 |
| Macedonians | 99.2 /100 | #91 | Exceptional $49,893 |
| Immigrants | Argentina | 99.2 /100 | #92 | Exceptional $49,841 |
| Armenians | 99.1 /100 | #93 | Exceptional $49,804 |
Demographics Similar to Tohono O'odham by Median Earnings
In terms of median earnings, the demographic groups most similar to Tohono O'odham are Arapaho ($36,586, a difference of 0.65%), Yup'ik ($35,942, a difference of 1.1%), Pueblo ($36,859, a difference of 1.4%), Hopi ($36,871, a difference of 1.4%), and Lumbee ($36,876, a difference of 1.5%).
| Demographics | Rating | Rank | Median Earnings |
| Houma | 0.0 /100 | #333 | Tragic $38,949 |
| Spanish American Indians | 0.0 /100 | #334 | Tragic $38,907 |
| Natives/Alaskans | 0.0 /100 | #335 | Tragic $38,896 |
| Crow | 0.0 /100 | #336 | Tragic $38,707 |
| Immigrants | Cuba | 0.0 /100 | #337 | Tragic $38,426 |
| Pima | 0.0 /100 | #338 | Tragic $38,285 |
| Menominee | 0.0 /100 | #339 | Tragic $37,884 |
| Navajo | 0.0 /100 | #340 | Tragic $36,999 |
| Lumbee | 0.0 /100 | #341 | Tragic $36,876 |
| Hopi | 0.0 /100 | #342 | Tragic $36,871 |
| Pueblo | 0.0 /100 | #343 | Tragic $36,859 |
| Arapaho | 0.0 /100 | #344 | Tragic $36,586 |
| Tohono O'odham | 0.0 /100 | #345 | Tragic $36,349 |
| Yup'ik | 0.0 /100 | #346 | Tragic $35,942 |
| Puerto Ricans | 0.0 /100 | #347 | Tragic $35,560 |