Honduran vs Immigrants from Israel Householder Income Over 65 years
COMPARE
Honduran
Immigrants from Israel
Householder Income Over 65 years
Householder Income Over 65 years Comparison
Hondurans
Immigrants from Israel
$52,634
HOUSEHOLDER INCOME OVER 65 YEARS
0.0/ 100
METRIC RATING
309th/ 347
METRIC RANK
$69,857
HOUSEHOLDER INCOME OVER 65 YEARS
100.0/ 100
METRIC RATING
22nd/ 347
METRIC RANK
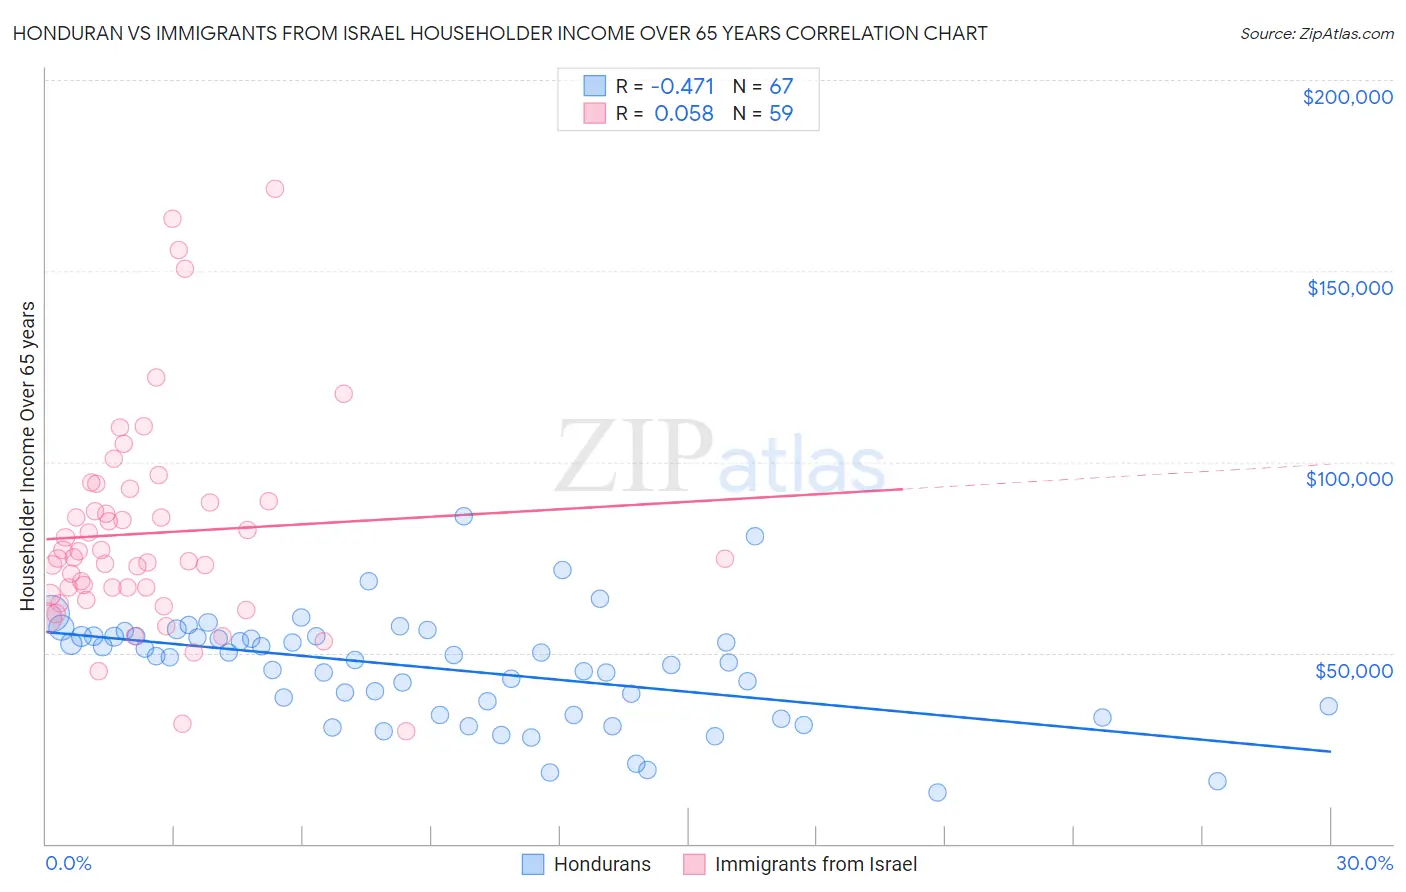
Honduran vs Immigrants from Israel Householder Income Over 65 years Correlation Chart
The statistical analysis conducted on geographies consisting of 356,652,935 people shows a moderate negative correlation between the proportion of Hondurans and household income with householder over the age of 65 in the United States with a correlation coefficient (R) of -0.471 and weighted average of $52,634. Similarly, the statistical analysis conducted on geographies consisting of 209,649,520 people shows a slight positive correlation between the proportion of Immigrants from Israel and household income with householder over the age of 65 in the United States with a correlation coefficient (R) of 0.058 and weighted average of $69,857, a difference of 32.7%.
Householder Income Over 65 years Correlation Summary
| Measurement | Honduran | Immigrants from Israel |
| Minimum | $13,371 | $29,457 |
| Maximum | $85,625 | $171,563 |
| Range | $72,254 | $142,106 |
| Mean | $45,868 | $81,354 |
| Median | $48,924 | $74,737 |
| Interquartile 25% (IQ1) | $33,750 | $65,166 |
| Interquartile 75% (IQ3) | $54,223 | $89,688 |
| Interquartile Range (IQR) | $20,473 | $24,522 |
| Standard Deviation (Sample) | $14,320 | $28,278 |
| Standard Deviation (Population) | $14,213 | $28,038 |
Similar Demographics by Householder Income Over 65 years
Demographics Similar to Hondurans by Householder Income Over 65 years
In terms of householder income over 65 years, the demographic groups most similar to Hondurans are Sioux ($52,509, a difference of 0.24%), Immigrants from Mexico ($52,801, a difference of 0.32%), Hispanic or Latino ($52,832, a difference of 0.38%), Pennsylvania German ($52,888, a difference of 0.48%), and Seminole ($52,373, a difference of 0.50%).
| Demographics | Rating | Rank | Householder Income Over 65 years |
| Spanish American Indians | 0.0 /100 | #302 | Tragic $53,077 |
| Choctaw | 0.0 /100 | #303 | Tragic $53,060 |
| Ute | 0.0 /100 | #304 | Tragic $52,949 |
| Pueblo | 0.0 /100 | #305 | Tragic $52,930 |
| Pennsylvania Germans | 0.0 /100 | #306 | Tragic $52,888 |
| Hispanics or Latinos | 0.0 /100 | #307 | Tragic $52,832 |
| Immigrants | Mexico | 0.0 /100 | #308 | Tragic $52,801 |
| Hondurans | 0.0 /100 | #309 | Tragic $52,634 |
| Sioux | 0.0 /100 | #310 | Tragic $52,509 |
| Seminole | 0.0 /100 | #311 | Tragic $52,373 |
| Immigrants | Azores | 0.0 /100 | #312 | Tragic $52,121 |
| Immigrants | Nicaragua | 0.0 /100 | #313 | Tragic $52,085 |
| Natives/Alaskans | 0.0 /100 | #314 | Tragic $52,081 |
| U.S. Virgin Islanders | 0.0 /100 | #315 | Tragic $52,072 |
| Creek | 0.0 /100 | #316 | Tragic $51,949 |
Demographics Similar to Immigrants from Israel by Householder Income Over 65 years
In terms of householder income over 65 years, the demographic groups most similar to Immigrants from Israel are Immigrants from Eastern Asia ($69,872, a difference of 0.020%), Immigrants from Japan ($69,774, a difference of 0.12%), Immigrants from Sweden ($69,722, a difference of 0.19%), Immigrants from Belgium ($69,703, a difference of 0.22%), and Immigrants from South Central Asia ($70,103, a difference of 0.35%).
| Demographics | Rating | Rank | Householder Income Over 65 years |
| Native Hawaiians | 100.0 /100 | #15 | Exceptional $71,021 |
| Okinawans | 100.0 /100 | #16 | Exceptional $70,846 |
| Immigrants | Korea | 100.0 /100 | #17 | Exceptional $70,696 |
| Eastern Europeans | 100.0 /100 | #18 | Exceptional $70,470 |
| Indians (Asian) | 100.0 /100 | #19 | Exceptional $70,238 |
| Immigrants | South Central Asia | 100.0 /100 | #20 | Exceptional $70,103 |
| Immigrants | Eastern Asia | 100.0 /100 | #21 | Exceptional $69,872 |
| Immigrants | Israel | 100.0 /100 | #22 | Exceptional $69,857 |
| Immigrants | Japan | 100.0 /100 | #23 | Exceptional $69,774 |
| Immigrants | Sweden | 100.0 /100 | #24 | Exceptional $69,722 |
| Immigrants | Belgium | 100.0 /100 | #25 | Exceptional $69,703 |
| Immigrants | Sri Lanka | 100.0 /100 | #26 | Exceptional $69,426 |
| Immigrants | Switzerland | 100.0 /100 | #27 | Exceptional $69,343 |
| Immigrants | China | 100.0 /100 | #28 | Exceptional $69,174 |
| Immigrants | Australia | 100.0 /100 | #29 | Exceptional $69,164 |