Immigrants from Spain vs Pima Median Household Income
COMPARE
Immigrants from Spain
Pima
Median Household Income
Median Household Income Comparison
Immigrants from Spain
Pima
$92,732
MEDIAN HOUSEHOLD INCOME
99.3/ 100
METRIC RATING
82nd/ 347
METRIC RANK
$63,262
MEDIAN HOUSEHOLD INCOME
0.0/ 100
METRIC RATING
342nd/ 347
METRIC RANK
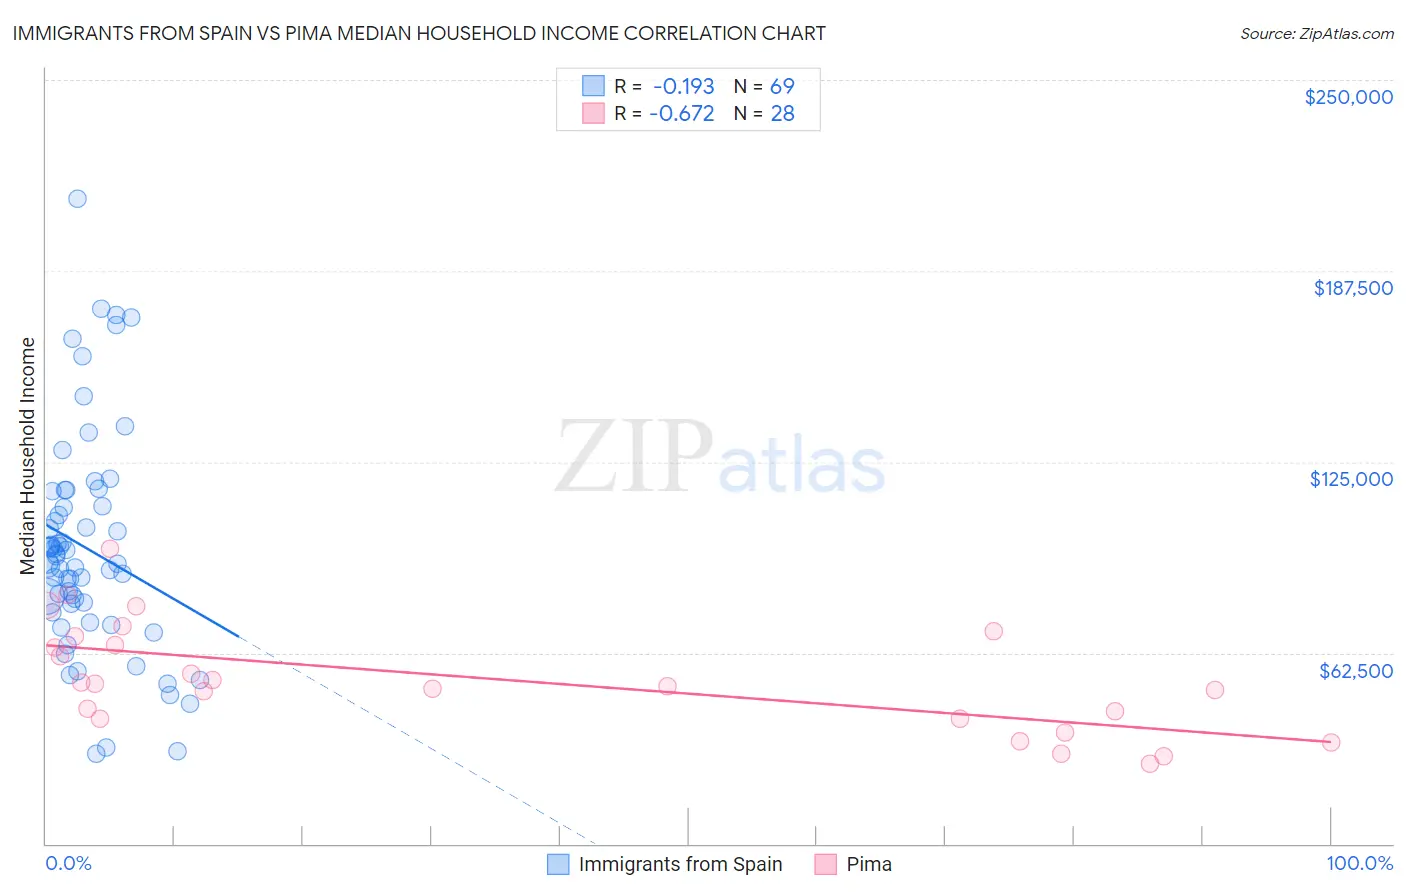
Immigrants from Spain vs Pima Median Household Income Correlation Chart
The statistical analysis conducted on geographies consisting of 239,554,501 people shows a poor negative correlation between the proportion of Immigrants from Spain and median household income in the United States with a correlation coefficient (R) of -0.193 and weighted average of $92,732. Similarly, the statistical analysis conducted on geographies consisting of 61,537,269 people shows a significant negative correlation between the proportion of Pima and median household income in the United States with a correlation coefficient (R) of -0.672 and weighted average of $63,262, a difference of 46.6%.
Median Household Income Correlation Summary
| Measurement | Immigrants from Spain | Pima |
| Minimum | $29,291 | $26,339 |
| Maximum | $211,250 | $96,415 |
| Range | $181,959 | $70,076 |
| Mean | $96,765 | $53,826 |
| Median | $92,124 | $52,032 |
| Interquartile 25% (IQ1) | $77,194 | $40,965 |
| Interquartile 75% (IQ3) | $112,999 | $66,485 |
| Interquartile Range (IQR) | $35,805 | $25,519 |
| Standard Deviation (Sample) | $36,186 | $17,724 |
| Standard Deviation (Population) | $35,922 | $17,405 |
Similar Demographics by Median Household Income
Demographics Similar to Immigrants from Spain by Median Household Income
In terms of median household income, the demographic groups most similar to Immigrants from Spain are Italian ($92,475, a difference of 0.28%), Immigrants from Eastern Europe ($93,051, a difference of 0.34%), Immigrants from Argentina ($92,417, a difference of 0.34%), Tongan ($93,076, a difference of 0.37%), and Sri Lankan ($93,093, a difference of 0.39%).
| Demographics | Rating | Rank | Median Household Income |
| Immigrants | Italy | 99.5 /100 | #75 | Exceptional $93,465 |
| South Africans | 99.5 /100 | #76 | Exceptional $93,379 |
| Immigrants | Afghanistan | 99.5 /100 | #77 | Exceptional $93,375 |
| Immigrants | Bulgaria | 99.4 /100 | #78 | Exceptional $93,148 |
| Sri Lankans | 99.4 /100 | #79 | Exceptional $93,093 |
| Tongans | 99.4 /100 | #80 | Exceptional $93,076 |
| Immigrants | Eastern Europe | 99.4 /100 | #81 | Exceptional $93,051 |
| Immigrants | Spain | 99.3 /100 | #82 | Exceptional $92,732 |
| Italians | 99.1 /100 | #83 | Exceptional $92,475 |
| Immigrants | Argentina | 99.1 /100 | #84 | Exceptional $92,417 |
| Immigrants | Croatia | 99.0 /100 | #85 | Exceptional $92,225 |
| Immigrants | England | 98.9 /100 | #86 | Exceptional $92,098 |
| Immigrants | Hungary | 98.9 /100 | #87 | Exceptional $92,094 |
| Immigrants | Canada | 98.8 /100 | #88 | Exceptional $92,029 |
| Romanians | 98.8 /100 | #89 | Exceptional $91,994 |
Demographics Similar to Pima by Median Household Income
In terms of median household income, the demographic groups most similar to Pima are Crow ($63,681, a difference of 0.66%), Houma ($62,575, a difference of 1.1%), Pueblo ($64,692, a difference of 2.3%), Tohono O'odham ($61,663, a difference of 2.6%), and Hopi ($65,043, a difference of 2.8%).
| Demographics | Rating | Rank | Median Household Income |
| Creek | 0.0 /100 | #333 | Tragic $67,715 |
| Blacks/African Americans | 0.0 /100 | #334 | Tragic $67,573 |
| Cheyenne | 0.0 /100 | #335 | Tragic $66,974 |
| Immigrants | Congo | 0.0 /100 | #336 | Tragic $66,768 |
| Kiowa | 0.0 /100 | #337 | Tragic $65,914 |
| Immigrants | Yemen | 0.0 /100 | #338 | Tragic $65,194 |
| Hopi | 0.0 /100 | #339 | Tragic $65,043 |
| Pueblo | 0.0 /100 | #340 | Tragic $64,692 |
| Crow | 0.0 /100 | #341 | Tragic $63,681 |
| Pima | 0.0 /100 | #342 | Tragic $63,262 |
| Houma | 0.0 /100 | #343 | Tragic $62,575 |
| Tohono O'odham | 0.0 /100 | #344 | Tragic $61,663 |
| Puerto Ricans | 0.0 /100 | #345 | Tragic $59,197 |
| Navajo | 0.0 /100 | #346 | Tragic $59,159 |
| Lumbee | 0.0 /100 | #347 | Tragic $54,644 |