Immigrants from Kenya vs Immigrants from Guatemala Householder Income Ages 25 - 44 years
COMPARE
Immigrants from Kenya
Immigrants from Guatemala
Householder Income Ages 25 - 44 years
Householder Income Ages 25 - 44 years Comparison
Immigrants from Kenya
Immigrants from Guatemala
$90,767
HOUSEHOLDER INCOME AGES 25 - 44 YEARS
10.9/ 100
METRIC RATING
210th/ 347
METRIC RANK
$81,341
HOUSEHOLDER INCOME AGES 25 - 44 YEARS
0.1/ 100
METRIC RATING
297th/ 347
METRIC RANK
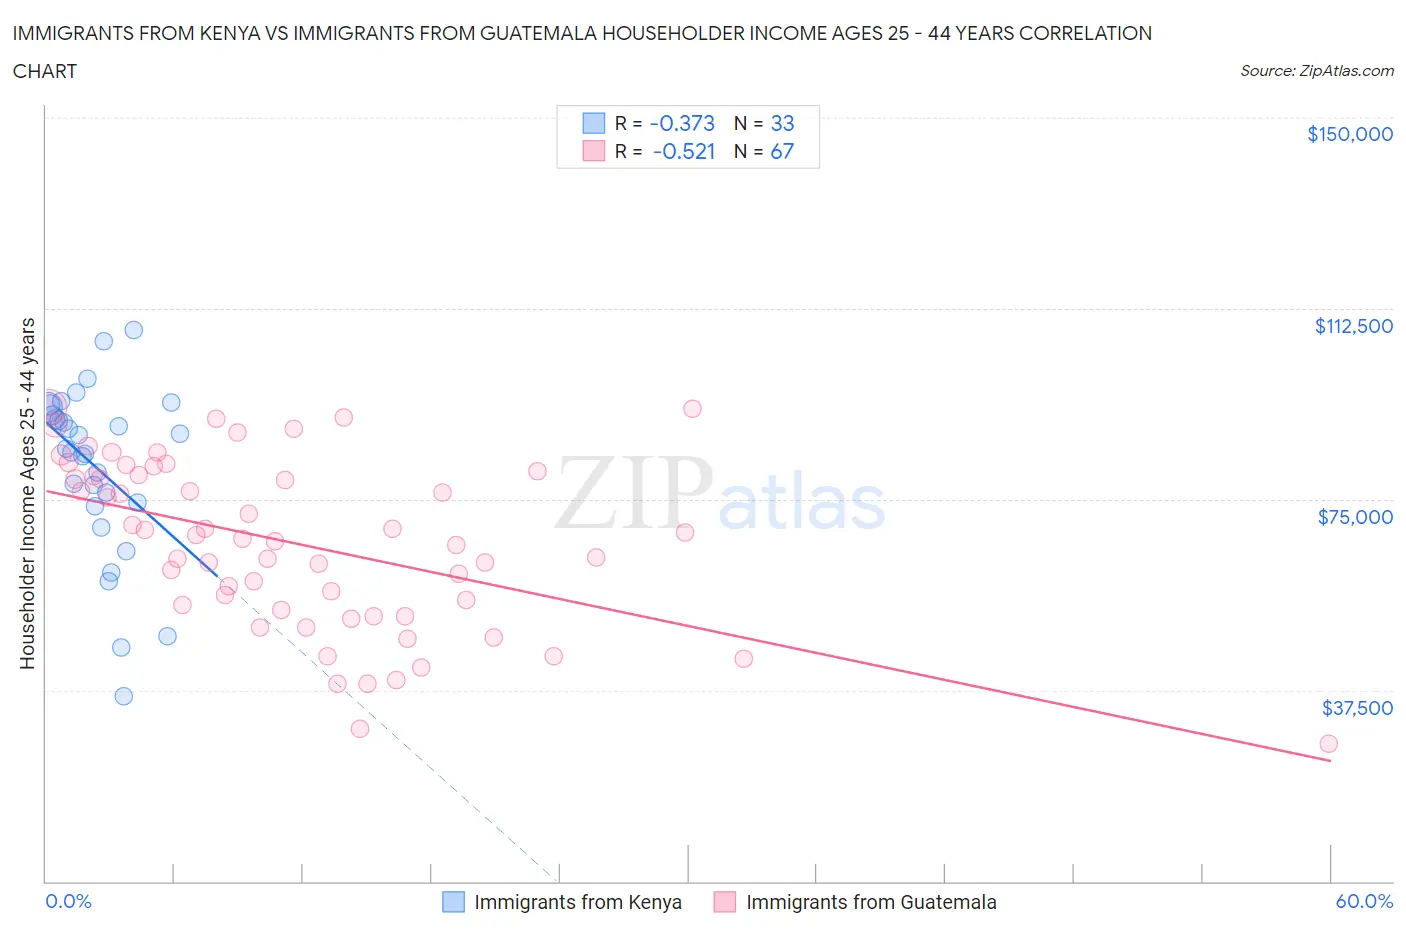
Immigrants from Kenya vs Immigrants from Guatemala Householder Income Ages 25 - 44 years Correlation Chart
The statistical analysis conducted on geographies consisting of 217,833,314 people shows a mild negative correlation between the proportion of Immigrants from Kenya and household income with householder between the ages 25 and 44 in the United States with a correlation coefficient (R) of -0.373 and weighted average of $90,767. Similarly, the statistical analysis conducted on geographies consisting of 376,665,002 people shows a substantial negative correlation between the proportion of Immigrants from Guatemala and household income with householder between the ages 25 and 44 in the United States with a correlation coefficient (R) of -0.521 and weighted average of $81,341, a difference of 11.6%.
Householder Income Ages 25 - 44 years Correlation Summary
| Measurement | Immigrants from Kenya | Immigrants from Guatemala |
| Minimum | $36,409 | $26,896 |
| Maximum | $108,304 | $93,165 |
| Range | $71,895 | $66,269 |
| Mean | $81,270 | $66,180 |
| Median | $85,004 | $67,229 |
| Interquartile 25% (IQ1) | $73,989 | $53,322 |
| Interquartile 75% (IQ3) | $92,370 | $79,855 |
| Interquartile Range (IQR) | $18,381 | $26,533 |
| Standard Deviation (Sample) | $16,718 | $16,514 |
| Standard Deviation (Population) | $16,463 | $16,390 |
Similar Demographics by Householder Income Ages 25 - 44 years
Demographics Similar to Immigrants from Kenya by Householder Income Ages 25 - 44 years
In terms of householder income ages 25 - 44 years, the demographic groups most similar to Immigrants from Kenya are Iraqi ($90,764, a difference of 0.0%), Hawaiian ($90,722, a difference of 0.050%), Immigrants from Bangladesh ($90,448, a difference of 0.35%), Immigrants from Africa ($90,372, a difference of 0.44%), and Immigrants from Uruguay ($91,171, a difference of 0.45%).
| Demographics | Rating | Rank | Householder Income Ages 25 - 44 years |
| Immigrants | Cambodia | 15.7 /100 | #203 | Poor $91,533 |
| Nepalese | 15.4 /100 | #204 | Poor $91,498 |
| Immigrants | Eastern Africa | 15.2 /100 | #205 | Poor $91,458 |
| Aleuts | 14.5 /100 | #206 | Poor $91,370 |
| Yugoslavians | 14.5 /100 | #207 | Poor $91,368 |
| Immigrants | Thailand | 14.3 /100 | #208 | Poor $91,337 |
| Immigrants | Uruguay | 13.2 /100 | #209 | Poor $91,171 |
| Immigrants | Kenya | 10.9 /100 | #210 | Poor $90,767 |
| Iraqis | 10.8 /100 | #211 | Poor $90,764 |
| Hawaiians | 10.6 /100 | #212 | Poor $90,722 |
| Immigrants | Bangladesh | 9.3 /100 | #213 | Tragic $90,448 |
| Immigrants | Africa | 8.9 /100 | #214 | Tragic $90,372 |
| Panamanians | 8.1 /100 | #215 | Tragic $90,193 |
| Ghanaians | 7.9 /100 | #216 | Tragic $90,137 |
| Scotch-Irish | 7.3 /100 | #217 | Tragic $89,969 |
Demographics Similar to Immigrants from Guatemala by Householder Income Ages 25 - 44 years
In terms of householder income ages 25 - 44 years, the demographic groups most similar to Immigrants from Guatemala are Immigrants from Dominica ($81,351, a difference of 0.010%), Bangladeshi ($81,363, a difference of 0.030%), Dominican ($81,229, a difference of 0.14%), Cuban ($81,483, a difference of 0.17%), and Blackfeet ($81,531, a difference of 0.23%).
| Demographics | Rating | Rank | Householder Income Ages 25 - 44 years |
| Liberians | 0.1 /100 | #290 | Tragic $82,005 |
| Potawatomi | 0.1 /100 | #291 | Tragic $81,774 |
| Yaqui | 0.1 /100 | #292 | Tragic $81,656 |
| Blackfeet | 0.1 /100 | #293 | Tragic $81,531 |
| Cubans | 0.1 /100 | #294 | Tragic $81,483 |
| Bangladeshis | 0.1 /100 | #295 | Tragic $81,363 |
| Immigrants | Dominica | 0.1 /100 | #296 | Tragic $81,351 |
| Immigrants | Guatemala | 0.1 /100 | #297 | Tragic $81,341 |
| Dominicans | 0.1 /100 | #298 | Tragic $81,229 |
| Immigrants | Liberia | 0.1 /100 | #299 | Tragic $80,863 |
| Cherokee | 0.0 /100 | #300 | Tragic $80,843 |
| Immigrants | Micronesia | 0.0 /100 | #301 | Tragic $80,544 |
| Hispanics or Latinos | 0.0 /100 | #302 | Tragic $80,515 |
| Mexicans | 0.0 /100 | #303 | Tragic $80,427 |
| Immigrants | Caribbean | 0.0 /100 | #304 | Tragic $80,326 |