Hawaiian vs Yugoslavian Median Male Earnings
COMPARE
Hawaiian
Yugoslavian
Median Male Earnings
Median Male Earnings Comparison
Hawaiians
Yugoslavians
$50,488
MEDIAN MALE EARNINGS
1.9/ 100
METRIC RATING
245th/ 347
METRIC RANK
$53,967
MEDIAN MALE EARNINGS
37.4/ 100
METRIC RATING
182nd/ 347
METRIC RANK
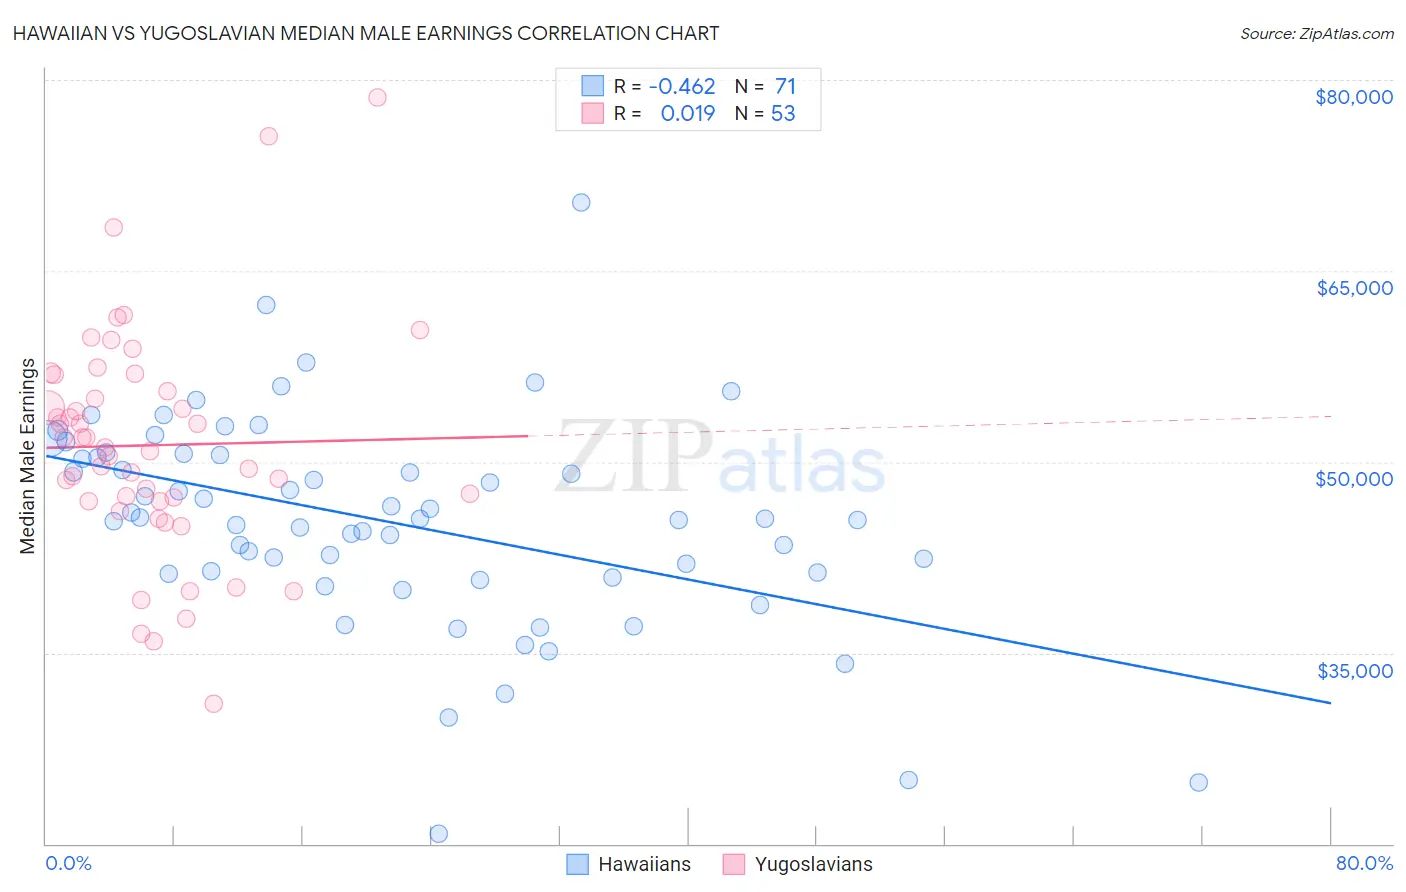
Hawaiian vs Yugoslavian Median Male Earnings Correlation Chart
The statistical analysis conducted on geographies consisting of 327,518,939 people shows a moderate negative correlation between the proportion of Hawaiians and median male earnings in the United States with a correlation coefficient (R) of -0.462 and weighted average of $50,488. Similarly, the statistical analysis conducted on geographies consisting of 285,670,858 people shows no correlation between the proportion of Yugoslavians and median male earnings in the United States with a correlation coefficient (R) of 0.019 and weighted average of $53,967, a difference of 6.9%.
Median Male Earnings Correlation Summary
| Measurement | Hawaiian | Yugoslavian |
| Minimum | $20,774 | $30,961 |
| Maximum | $70,362 | $78,594 |
| Range | $49,588 | $47,633 |
| Mean | $45,275 | $51,302 |
| Median | $45,568 | $51,102 |
| Interquartile 25% (IQ1) | $41,232 | $46,894 |
| Interquartile 75% (IQ3) | $50,512 | $56,167 |
| Interquartile Range (IQR) | $9,280 | $9,274 |
| Standard Deviation (Sample) | $8,332 | $8,961 |
| Standard Deviation (Population) | $8,273 | $8,876 |
Similar Demographics by Median Male Earnings
Demographics Similar to Hawaiians by Median Male Earnings
In terms of median male earnings, the demographic groups most similar to Hawaiians are Immigrants from Ecuador ($50,474, a difference of 0.030%), Houma ($50,547, a difference of 0.12%), Subsaharan African ($50,408, a difference of 0.16%), French American Indian ($50,611, a difference of 0.24%), and Guyanese ($50,613, a difference of 0.25%).
| Demographics | Rating | Rank | Median Male Earnings |
| Malaysians | 2.5 /100 | #238 | Tragic $50,772 |
| Americans | 2.5 /100 | #239 | Tragic $50,761 |
| West Indians | 2.3 /100 | #240 | Tragic $50,682 |
| Immigrants | St. Vincent and the Grenadines | 2.3 /100 | #241 | Tragic $50,665 |
| Guyanese | 2.2 /100 | #242 | Tragic $50,613 |
| French American Indians | 2.2 /100 | #243 | Tragic $50,611 |
| Houma | 2.0 /100 | #244 | Tragic $50,547 |
| Hawaiians | 1.9 /100 | #245 | Tragic $50,488 |
| Immigrants | Ecuador | 1.9 /100 | #246 | Tragic $50,474 |
| Sub-Saharan Africans | 1.8 /100 | #247 | Tragic $50,408 |
| Immigrants | Guyana | 1.6 /100 | #248 | Tragic $50,321 |
| Immigrants | Burma/Myanmar | 1.6 /100 | #249 | Tragic $50,298 |
| Osage | 1.6 /100 | #250 | Tragic $50,292 |
| Immigrants | Grenada | 1.6 /100 | #251 | Tragic $50,279 |
| Immigrants | Cabo Verde | 1.2 /100 | #252 | Tragic $50,009 |
Demographics Similar to Yugoslavians by Median Male Earnings
In terms of median male earnings, the demographic groups most similar to Yugoslavians are Immigrants from South America ($53,962, a difference of 0.010%), White/Caucasian ($53,925, a difference of 0.080%), Immigrants from Sierra Leone ($53,905, a difference of 0.11%), Colombian ($53,832, a difference of 0.25%), and Immigrants ($54,168, a difference of 0.37%).
| Demographics | Rating | Rank | Median Male Earnings |
| Dutch | 48.0 /100 | #175 | Average $54,410 |
| Spaniards | 47.8 /100 | #176 | Average $54,401 |
| Costa Ricans | 44.8 /100 | #177 | Average $54,279 |
| Sierra Leoneans | 44.8 /100 | #178 | Average $54,279 |
| Celtics | 43.9 /100 | #179 | Average $54,242 |
| Iraqis | 42.5 /100 | #180 | Average $54,182 |
| Immigrants | Immigrants | 42.1 /100 | #181 | Average $54,168 |
| Yugoslavians | 37.4 /100 | #182 | Fair $53,967 |
| Immigrants | South America | 37.3 /100 | #183 | Fair $53,962 |
| Whites/Caucasians | 36.5 /100 | #184 | Fair $53,925 |
| Immigrants | Sierra Leone | 36.0 /100 | #185 | Fair $53,905 |
| Colombians | 34.4 /100 | #186 | Fair $53,832 |
| Immigrants | Eritrea | 31.8 /100 | #187 | Fair $53,715 |
| Immigrants | Eastern Africa | 31.8 /100 | #188 | Fair $53,713 |
| Puget Sound Salish | 31.6 /100 | #189 | Fair $53,704 |