Immigrants from Denmark vs Celtic Median Male Earnings
COMPARE
Immigrants from Denmark
Celtic
Median Male Earnings
Median Male Earnings Comparison
Immigrants from Denmark
Celtics
$64,625
MEDIAN MALE EARNINGS
100.0/ 100
METRIC RATING
25th/ 347
METRIC RANK
$54,242
MEDIAN MALE EARNINGS
43.9/ 100
METRIC RATING
179th/ 347
METRIC RANK
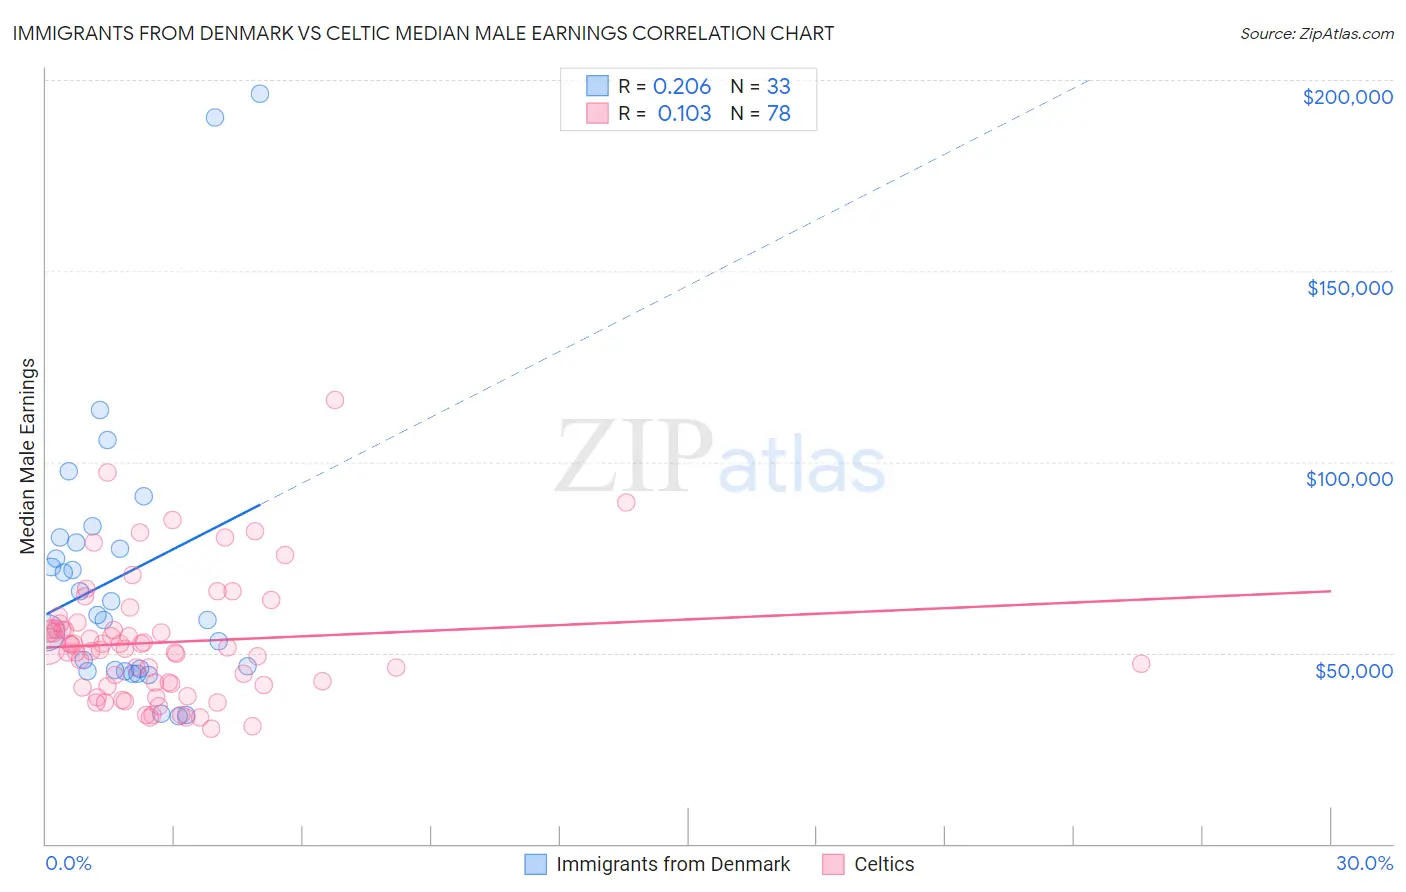
Immigrants from Denmark vs Celtic Median Male Earnings Correlation Chart
The statistical analysis conducted on geographies consisting of 136,409,110 people shows a weak positive correlation between the proportion of Immigrants from Denmark and median male earnings in the United States with a correlation coefficient (R) of 0.206 and weighted average of $64,625. Similarly, the statistical analysis conducted on geographies consisting of 168,835,253 people shows a poor positive correlation between the proportion of Celtics and median male earnings in the United States with a correlation coefficient (R) of 0.103 and weighted average of $54,242, a difference of 19.1%.
Median Male Earnings Correlation Summary
| Measurement | Immigrants from Denmark | Celtic |
| Minimum | $33,446 | $30,000 |
| Maximum | $196,250 | $116,250 |
| Range | $162,804 | $86,250 |
| Mean | $70,566 | $52,737 |
| Median | $59,978 | $51,157 |
| Interquartile 25% (IQ1) | $45,341 | $41,563 |
| Interquartile 75% (IQ3) | $79,588 | $56,235 |
| Interquartile Range (IQR) | $34,248 | $14,672 |
| Standard Deviation (Sample) | $37,718 | $16,099 |
| Standard Deviation (Population) | $37,142 | $15,995 |
Similar Demographics by Median Male Earnings
Demographics Similar to Immigrants from Denmark by Median Male Earnings
In terms of median male earnings, the demographic groups most similar to Immigrants from Denmark are Immigrants from Northern Europe ($64,987, a difference of 0.56%), Turkish ($64,253, a difference of 0.58%), Immigrants from Korea ($65,079, a difference of 0.70%), Burmese ($65,236, a difference of 0.95%), and Immigrants from Switzerland ($63,944, a difference of 1.1%).
| Demographics | Rating | Rank | Median Male Earnings |
| Indians (Asian) | 100.0 /100 | #18 | Exceptional $66,078 |
| Cypriots | 100.0 /100 | #19 | Exceptional $65,549 |
| Immigrants | Japan | 100.0 /100 | #20 | Exceptional $65,518 |
| Immigrants | Sweden | 100.0 /100 | #21 | Exceptional $65,406 |
| Burmese | 100.0 /100 | #22 | Exceptional $65,236 |
| Immigrants | Korea | 100.0 /100 | #23 | Exceptional $65,079 |
| Immigrants | Northern Europe | 100.0 /100 | #24 | Exceptional $64,987 |
| Immigrants | Denmark | 100.0 /100 | #25 | Exceptional $64,625 |
| Turks | 100.0 /100 | #26 | Exceptional $64,253 |
| Immigrants | Switzerland | 100.0 /100 | #27 | Exceptional $63,944 |
| Russians | 100.0 /100 | #28 | Exceptional $63,939 |
| Asians | 100.0 /100 | #29 | Exceptional $63,827 |
| Immigrants | France | 100.0 /100 | #30 | Exceptional $63,715 |
| Latvians | 100.0 /100 | #31 | Exceptional $63,498 |
| Soviet Union | 100.0 /100 | #32 | Exceptional $63,382 |
Demographics Similar to Celtics by Median Male Earnings
In terms of median male earnings, the demographic groups most similar to Celtics are Costa Rican ($54,279, a difference of 0.070%), Sierra Leonean ($54,279, a difference of 0.070%), Iraqi ($54,182, a difference of 0.11%), Immigrants ($54,168, a difference of 0.14%), and Spaniard ($54,401, a difference of 0.29%).
| Demographics | Rating | Rank | Median Male Earnings |
| Welsh | 53.8 /100 | #172 | Average $54,647 |
| South American Indians | 50.4 /100 | #173 | Average $54,508 |
| South Americans | 50.0 /100 | #174 | Average $54,492 |
| Dutch | 48.0 /100 | #175 | Average $54,410 |
| Spaniards | 47.8 /100 | #176 | Average $54,401 |
| Costa Ricans | 44.8 /100 | #177 | Average $54,279 |
| Sierra Leoneans | 44.8 /100 | #178 | Average $54,279 |
| Celtics | 43.9 /100 | #179 | Average $54,242 |
| Iraqis | 42.5 /100 | #180 | Average $54,182 |
| Immigrants | Immigrants | 42.1 /100 | #181 | Average $54,168 |
| Yugoslavians | 37.4 /100 | #182 | Fair $53,967 |
| Immigrants | South America | 37.3 /100 | #183 | Fair $53,962 |
| Whites/Caucasians | 36.5 /100 | #184 | Fair $53,925 |
| Immigrants | Sierra Leone | 36.0 /100 | #185 | Fair $53,905 |
| Colombians | 34.4 /100 | #186 | Fair $53,832 |