Haitian vs Sudanese Householder Income Under 25 years
COMPARE
Haitian
Sudanese
Householder Income Under 25 years
Householder Income Under 25 years Comparison
Haitians
Sudanese
$50,231
HOUSEHOLDER INCOME UNDER 25 YEARS
0.8/ 100
METRIC RATING
262nd/ 347
METRIC RANK
$46,982
HOUSEHOLDER INCOME UNDER 25 YEARS
0.0/ 100
METRIC RATING
316th/ 347
METRIC RANK
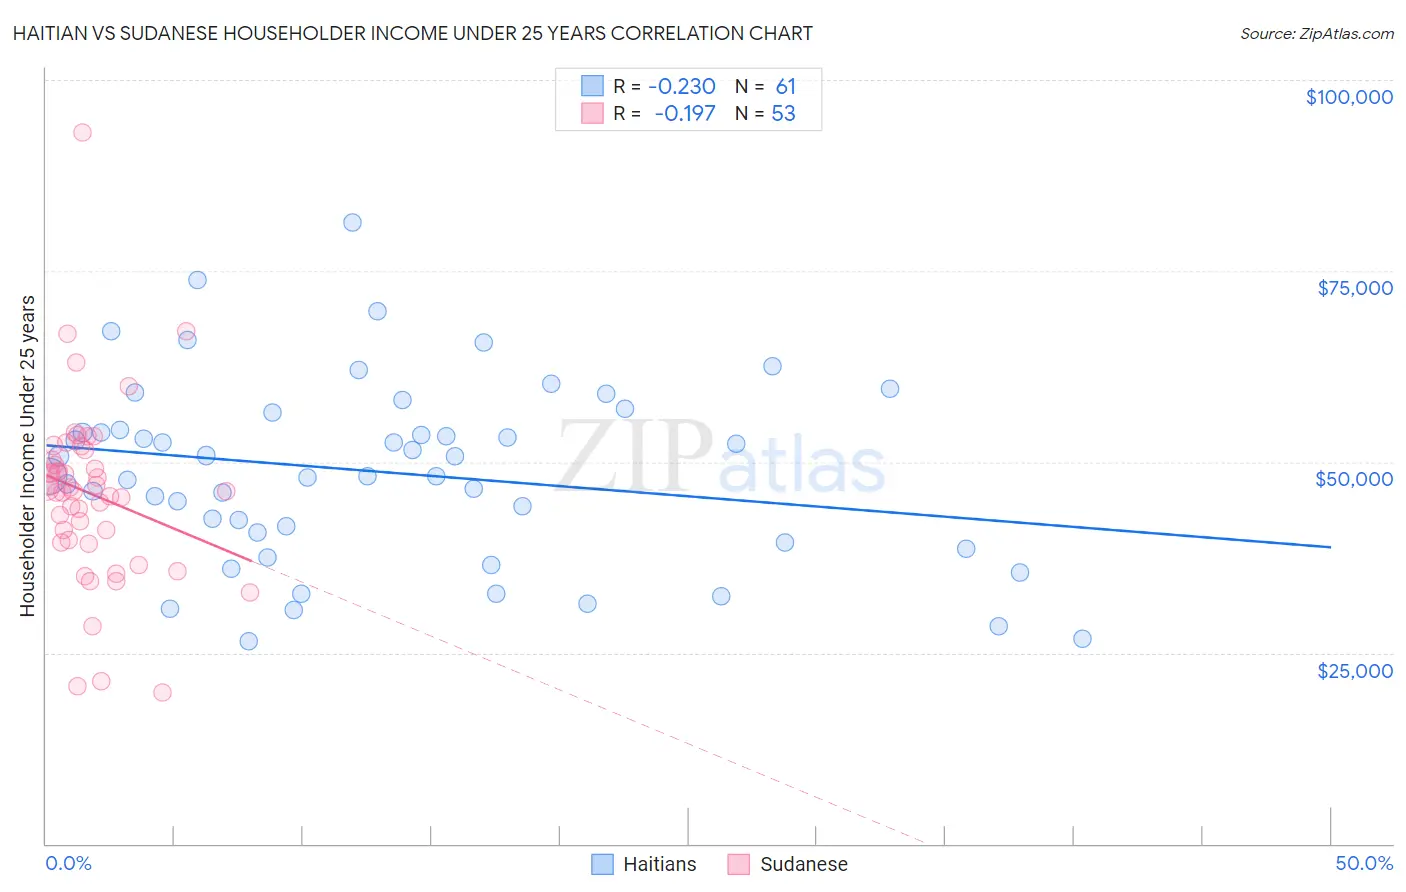
Haitian vs Sudanese Householder Income Under 25 years Correlation Chart
The statistical analysis conducted on geographies consisting of 247,862,749 people shows a weak negative correlation between the proportion of Haitians and household income with householder under the age of 25 in the United States with a correlation coefficient (R) of -0.230 and weighted average of $50,231. Similarly, the statistical analysis conducted on geographies consisting of 104,582,172 people shows a poor negative correlation between the proportion of Sudanese and household income with householder under the age of 25 in the United States with a correlation coefficient (R) of -0.197 and weighted average of $46,982, a difference of 6.9%.
Householder Income Under 25 years Correlation Summary
| Measurement | Haitian | Sudanese |
| Minimum | $26,478 | $19,757 |
| Maximum | $81,415 | $93,063 |
| Range | $54,938 | $73,306 |
| Mean | $48,683 | $45,800 |
| Median | $48,098 | $46,181 |
| Interquartile 25% (IQ1) | $40,094 | $39,636 |
| Interquartile 75% (IQ3) | $55,303 | $50,904 |
| Interquartile Range (IQR) | $15,209 | $11,268 |
| Standard Deviation (Sample) | $11,920 | $11,891 |
| Standard Deviation (Population) | $11,822 | $11,778 |
Similar Demographics by Householder Income Under 25 years
Demographics Similar to Haitians by Householder Income Under 25 years
In terms of householder income under 25 years, the demographic groups most similar to Haitians are Hungarian ($50,247, a difference of 0.030%), Immigrants from Dominican Republic ($50,204, a difference of 0.050%), Hispanic or Latino ($50,279, a difference of 0.10%), Immigrants from Dominica ($50,301, a difference of 0.14%), and Fijian ($50,132, a difference of 0.20%).
| Demographics | Rating | Rank | Householder Income Under 25 years |
| Aleuts | 1.2 /100 | #255 | Tragic $50,377 |
| Immigrants | Cuba | 1.2 /100 | #256 | Tragic $50,374 |
| Lebanese | 1.1 /100 | #257 | Tragic $50,355 |
| Whites/Caucasians | 1.1 /100 | #258 | Tragic $50,336 |
| Immigrants | Dominica | 1.0 /100 | #259 | Tragic $50,301 |
| Hispanics or Latinos | 0.9 /100 | #260 | Tragic $50,279 |
| Hungarians | 0.9 /100 | #261 | Tragic $50,247 |
| Haitians | 0.8 /100 | #262 | Tragic $50,231 |
| Immigrants | Dominican Republic | 0.8 /100 | #263 | Tragic $50,204 |
| Fijians | 0.6 /100 | #264 | Tragic $50,132 |
| Belgians | 0.6 /100 | #265 | Tragic $50,113 |
| Immigrants | Venezuela | 0.6 /100 | #266 | Tragic $50,109 |
| Immigrants | Laos | 0.5 /100 | #267 | Tragic $50,041 |
| Venezuelans | 0.5 /100 | #268 | Tragic $50,011 |
| Ute | 0.5 /100 | #269 | Tragic $49,997 |
Demographics Similar to Sudanese by Householder Income Under 25 years
In terms of householder income under 25 years, the demographic groups most similar to Sudanese are Hopi ($46,978, a difference of 0.010%), Crow ($47,012, a difference of 0.060%), Chippewa ($47,015, a difference of 0.070%), Spanish American ($46,913, a difference of 0.15%), and African ($46,838, a difference of 0.31%).
| Demographics | Rating | Rank | Householder Income Under 25 years |
| U.S. Virgin Islanders | 0.0 /100 | #309 | Tragic $47,448 |
| Iroquois | 0.0 /100 | #310 | Tragic $47,380 |
| Ottawa | 0.0 /100 | #311 | Tragic $47,366 |
| Bermudans | 0.0 /100 | #312 | Tragic $47,359 |
| Delaware | 0.0 /100 | #313 | Tragic $47,159 |
| Chippewa | 0.0 /100 | #314 | Tragic $47,015 |
| Crow | 0.0 /100 | #315 | Tragic $47,012 |
| Sudanese | 0.0 /100 | #316 | Tragic $46,982 |
| Hopi | 0.0 /100 | #317 | Tragic $46,978 |
| Spanish Americans | 0.0 /100 | #318 | Tragic $46,913 |
| Africans | 0.0 /100 | #319 | Tragic $46,838 |
| Immigrants | Sudan | 0.0 /100 | #320 | Tragic $46,791 |
| Potawatomi | 0.0 /100 | #321 | Tragic $46,462 |
| Sioux | 0.0 /100 | #322 | Tragic $46,417 |
| Immigrants | Saudi Arabia | 0.0 /100 | #323 | Tragic $46,187 |