Iroquois vs Sudanese Householder Income Under 25 years
COMPARE
Iroquois
Sudanese
Householder Income Under 25 years
Householder Income Under 25 years Comparison
Iroquois
Sudanese
$47,380
HOUSEHOLDER INCOME UNDER 25 YEARS
0.0/ 100
METRIC RATING
310th/ 347
METRIC RANK
$46,982
HOUSEHOLDER INCOME UNDER 25 YEARS
0.0/ 100
METRIC RATING
316th/ 347
METRIC RANK
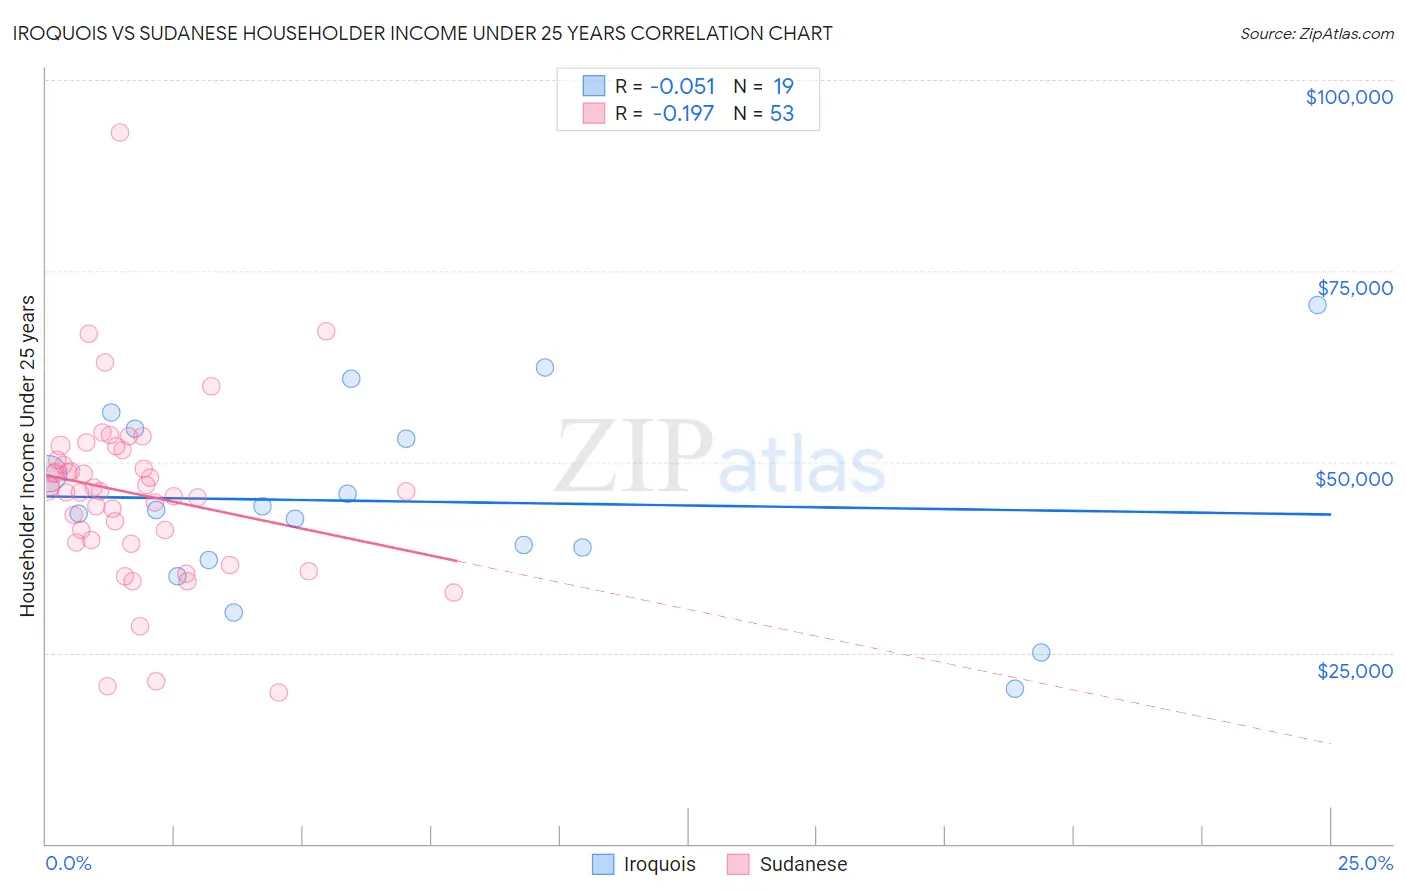
Iroquois vs Sudanese Householder Income Under 25 years Correlation Chart
The statistical analysis conducted on geographies consisting of 187,377,490 people shows a slight negative correlation between the proportion of Iroquois and household income with householder under the age of 25 in the United States with a correlation coefficient (R) of -0.051 and weighted average of $47,380. Similarly, the statistical analysis conducted on geographies consisting of 104,582,172 people shows a poor negative correlation between the proportion of Sudanese and household income with householder under the age of 25 in the United States with a correlation coefficient (R) of -0.197 and weighted average of $46,982, a difference of 0.85%.
Householder Income Under 25 years Correlation Summary
| Measurement | Iroquois | Sudanese |
| Minimum | $20,250 | $19,757 |
| Maximum | $70,577 | $93,063 |
| Range | $50,327 | $73,306 |
| Mean | $44,802 | $45,800 |
| Median | $43,754 | $46,181 |
| Interquartile 25% (IQ1) | $37,131 | $39,636 |
| Interquartile 75% (IQ3) | $54,399 | $50,904 |
| Interquartile Range (IQR) | $17,268 | $11,268 |
| Standard Deviation (Sample) | $12,869 | $11,891 |
| Standard Deviation (Population) | $12,525 | $11,778 |
Demographics Similar to Iroquois and Sudanese by Householder Income Under 25 years
In terms of householder income under 25 years, the demographic groups most similar to Iroquois are Ottawa ($47,366, a difference of 0.030%), Bermudan ($47,359, a difference of 0.040%), U.S. Virgin Islander ($47,448, a difference of 0.14%), Comanche ($47,518, a difference of 0.29%), and Bangladeshi ($47,589, a difference of 0.44%). Similarly, the demographic groups most similar to Sudanese are Hopi ($46,978, a difference of 0.010%), Crow ($47,012, a difference of 0.060%), Chippewa ($47,015, a difference of 0.070%), Spanish American ($46,913, a difference of 0.15%), and African ($46,838, a difference of 0.31%).
| Demographics | Rating | Rank | Householder Income Under 25 years |
| Immigrants | Middle Africa | 0.0 /100 | #303 | Tragic $47,916 |
| Menominee | 0.0 /100 | #304 | Tragic $47,907 |
| Cherokee | 0.0 /100 | #305 | Tragic $47,848 |
| Natives/Alaskans | 0.0 /100 | #306 | Tragic $47,704 |
| Bangladeshis | 0.0 /100 | #307 | Tragic $47,589 |
| Comanche | 0.0 /100 | #308 | Tragic $47,518 |
| U.S. Virgin Islanders | 0.0 /100 | #309 | Tragic $47,448 |
| Iroquois | 0.0 /100 | #310 | Tragic $47,380 |
| Ottawa | 0.0 /100 | #311 | Tragic $47,366 |
| Bermudans | 0.0 /100 | #312 | Tragic $47,359 |
| Delaware | 0.0 /100 | #313 | Tragic $47,159 |
| Chippewa | 0.0 /100 | #314 | Tragic $47,015 |
| Crow | 0.0 /100 | #315 | Tragic $47,012 |
| Sudanese | 0.0 /100 | #316 | Tragic $46,982 |
| Hopi | 0.0 /100 | #317 | Tragic $46,978 |
| Spanish Americans | 0.0 /100 | #318 | Tragic $46,913 |
| Africans | 0.0 /100 | #319 | Tragic $46,838 |
| Immigrants | Sudan | 0.0 /100 | #320 | Tragic $46,791 |
| Potawatomi | 0.0 /100 | #321 | Tragic $46,462 |
| Sioux | 0.0 /100 | #322 | Tragic $46,417 |
| Immigrants | Saudi Arabia | 0.0 /100 | #323 | Tragic $46,187 |