Haitian vs Cuban Householder Income Under 25 years
COMPARE
Haitian
Cuban
Householder Income Under 25 years
Householder Income Under 25 years Comparison
Haitians
Cubans
$50,231
HOUSEHOLDER INCOME UNDER 25 YEARS
0.8/ 100
METRIC RATING
262nd/ 347
METRIC RANK
$50,655
HOUSEHOLDER INCOME UNDER 25 YEARS
2.3/ 100
METRIC RATING
242nd/ 347
METRIC RANK
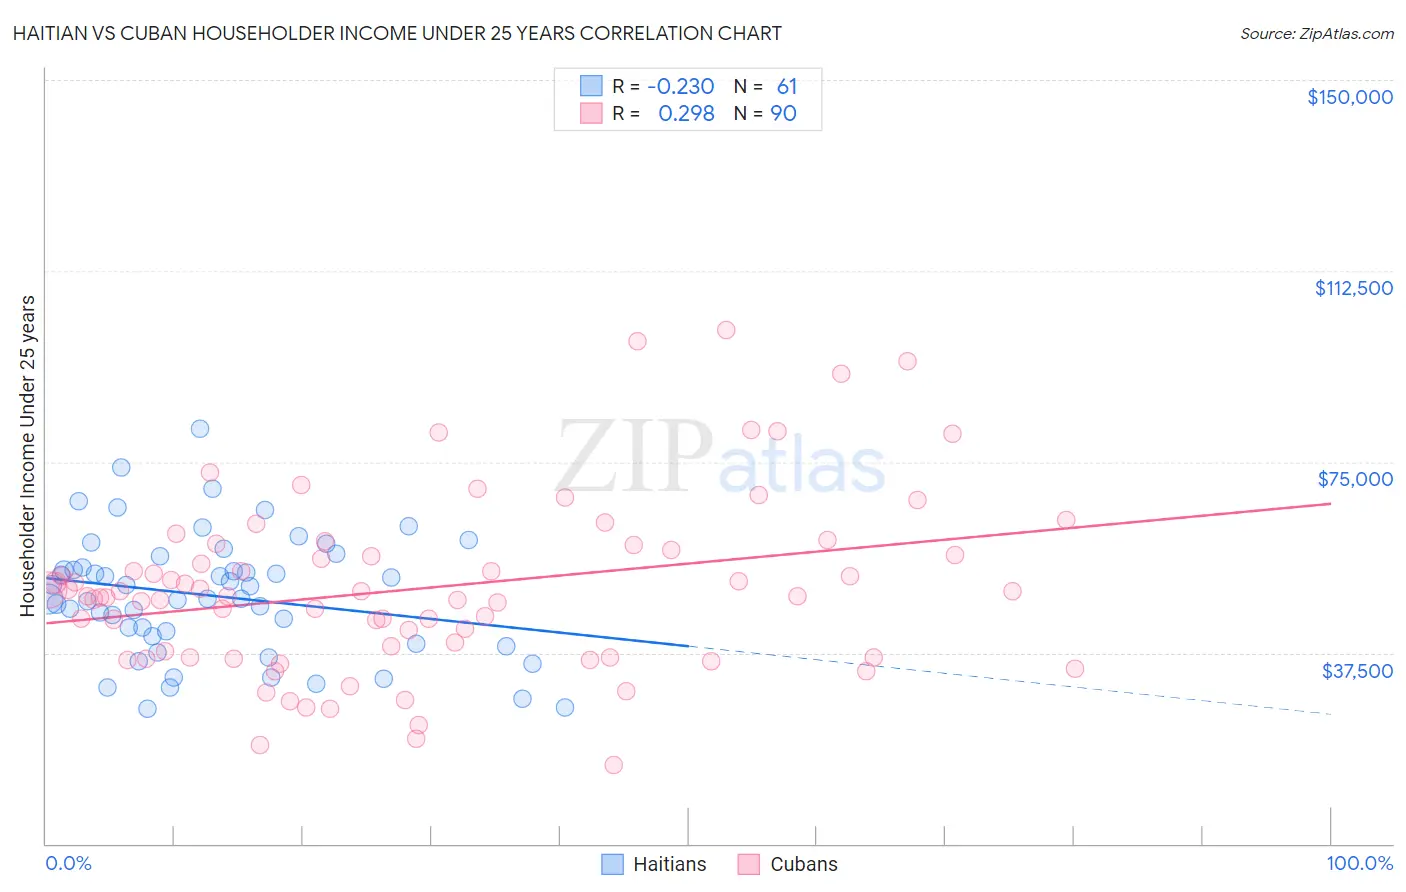
Haitian vs Cuban Householder Income Under 25 years Correlation Chart
The statistical analysis conducted on geographies consisting of 247,862,749 people shows a weak negative correlation between the proportion of Haitians and household income with householder under the age of 25 in the United States with a correlation coefficient (R) of -0.230 and weighted average of $50,231. Similarly, the statistical analysis conducted on geographies consisting of 372,353,328 people shows a weak positive correlation between the proportion of Cubans and household income with householder under the age of 25 in the United States with a correlation coefficient (R) of 0.298 and weighted average of $50,655, a difference of 0.84%.
Householder Income Under 25 years Correlation Summary
| Measurement | Haitian | Cuban |
| Minimum | $26,478 | $15,559 |
| Maximum | $81,415 | $100,948 |
| Range | $54,938 | $85,389 |
| Mean | $48,683 | $50,192 |
| Median | $48,098 | $48,589 |
| Interquartile 25% (IQ1) | $40,094 | $36,667 |
| Interquartile 75% (IQ3) | $55,303 | $57,791 |
| Interquartile Range (IQR) | $15,209 | $21,124 |
| Standard Deviation (Sample) | $11,920 | $17,185 |
| Standard Deviation (Population) | $11,822 | $17,090 |
Demographics Similar to Haitians and Cubans by Householder Income Under 25 years
In terms of householder income under 25 years, the demographic groups most similar to Haitians are Hungarian ($50,247, a difference of 0.030%), Hispanic or Latino ($50,279, a difference of 0.10%), Immigrants from Dominica ($50,301, a difference of 0.14%), White/Caucasian ($50,336, a difference of 0.21%), and Lebanese ($50,355, a difference of 0.25%). Similarly, the demographic groups most similar to Cubans are Immigrants from Thailand ($50,645, a difference of 0.020%), Marshallese ($50,627, a difference of 0.060%), Immigrants from Africa ($50,609, a difference of 0.090%), Welsh ($50,597, a difference of 0.12%), and Immigrants from Bosnia and Herzegovina ($50,565, a difference of 0.18%).
| Demographics | Rating | Rank | Householder Income Under 25 years |
| Cubans | 2.3 /100 | #242 | Tragic $50,655 |
| Immigrants | Thailand | 2.2 /100 | #243 | Tragic $50,645 |
| Marshallese | 2.1 /100 | #244 | Tragic $50,627 |
| Immigrants | Africa | 2.0 /100 | #245 | Tragic $50,609 |
| Welsh | 2.0 /100 | #246 | Tragic $50,597 |
| Immigrants | Bosnia and Herzegovina | 1.8 /100 | #247 | Tragic $50,565 |
| Slavs | 1.8 /100 | #248 | Tragic $50,563 |
| Scottish | 1.8 /100 | #249 | Tragic $50,554 |
| Immigrants | Cabo Verde | 1.7 /100 | #250 | Tragic $50,520 |
| Celtics | 1.4 /100 | #251 | Tragic $50,447 |
| Immigrants | Mexico | 1.3 /100 | #252 | Tragic $50,422 |
| Immigrants | Haiti | 1.2 /100 | #253 | Tragic $50,398 |
| Luxembourgers | 1.2 /100 | #254 | Tragic $50,379 |
| Aleuts | 1.2 /100 | #255 | Tragic $50,377 |
| Immigrants | Cuba | 1.2 /100 | #256 | Tragic $50,374 |
| Lebanese | 1.1 /100 | #257 | Tragic $50,355 |
| Whites/Caucasians | 1.1 /100 | #258 | Tragic $50,336 |
| Immigrants | Dominica | 1.0 /100 | #259 | Tragic $50,301 |
| Hispanics or Latinos | 0.9 /100 | #260 | Tragic $50,279 |
| Hungarians | 0.9 /100 | #261 | Tragic $50,247 |
| Haitians | 0.8 /100 | #262 | Tragic $50,231 |