Guamanian/Chamorro vs Immigrants from Western Africa Householder Income Ages 45 - 64 years
COMPARE
Guamanian/Chamorro
Immigrants from Western Africa
Householder Income Ages 45 - 64 years
Householder Income Ages 45 - 64 years Comparison
Guamanians/Chamorros
Immigrants from Western Africa
$101,170
HOUSEHOLDER INCOME AGES 45 - 64 YEARS
60.5/ 100
METRIC RATING
169th/ 347
METRIC RANK
$92,384
HOUSEHOLDER INCOME AGES 45 - 64 YEARS
1.8/ 100
METRIC RATING
236th/ 347
METRIC RANK
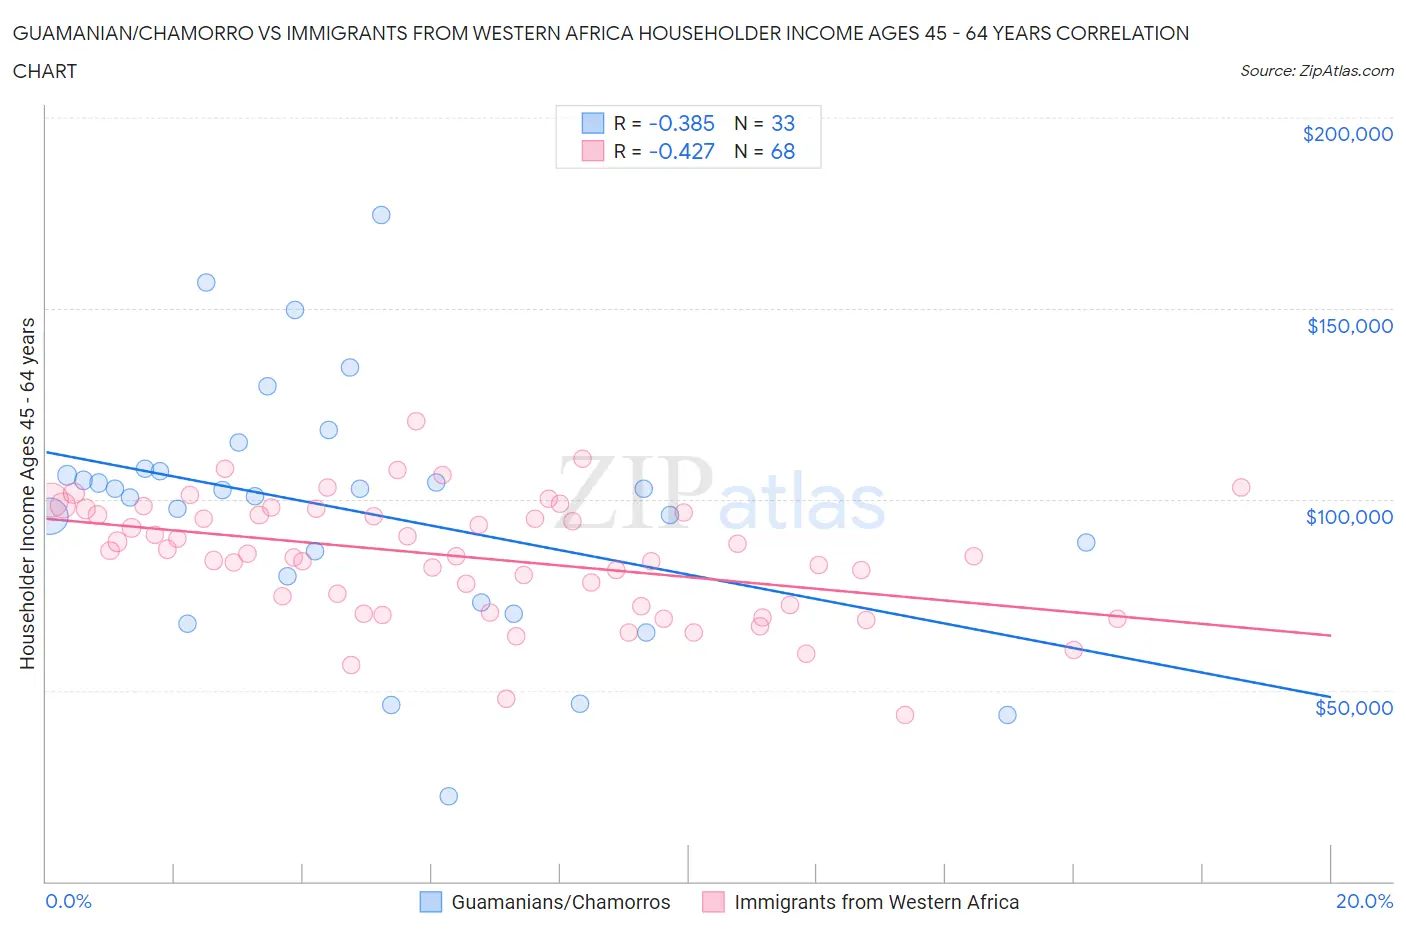
Guamanian/Chamorro vs Immigrants from Western Africa Householder Income Ages 45 - 64 years Correlation Chart
The statistical analysis conducted on geographies consisting of 221,751,742 people shows a mild negative correlation between the proportion of Guamanians/Chamorros and household income with householder between the ages 45 and 64 in the United States with a correlation coefficient (R) of -0.385 and weighted average of $101,170. Similarly, the statistical analysis conducted on geographies consisting of 357,146,562 people shows a moderate negative correlation between the proportion of Immigrants from Western Africa and household income with householder between the ages 45 and 64 in the United States with a correlation coefficient (R) of -0.427 and weighted average of $92,384, a difference of 9.5%.
Householder Income Ages 45 - 64 years Correlation Summary
| Measurement | Guamanian/Chamorro | Immigrants from Western Africa |
| Minimum | $22,381 | $43,559 |
| Maximum | $174,529 | $120,552 |
| Range | $152,148 | $76,993 |
| Mean | $97,072 | $84,916 |
| Median | $102,408 | $85,582 |
| Interquartile 25% (IQ1) | $76,408 | $72,214 |
| Interquartile 75% (IQ3) | $107,629 | $97,099 |
| Interquartile Range (IQR) | $31,221 | $24,885 |
| Standard Deviation (Sample) | $32,320 | $15,570 |
| Standard Deviation (Population) | $31,826 | $15,455 |
Similar Demographics by Householder Income Ages 45 - 64 years
Demographics Similar to Guamanians/Chamorros by Householder Income Ages 45 - 64 years
In terms of householder income ages 45 - 64 years, the demographic groups most similar to Guamanians/Chamorros are South American Indian ($101,171, a difference of 0.0%), Slovak ($101,029, a difference of 0.14%), Czechoslovakian ($101,387, a difference of 0.21%), South American ($100,837, a difference of 0.33%), and Samoan ($101,580, a difference of 0.41%).
| Demographics | Rating | Rank | Householder Income Ages 45 - 64 years |
| Scottish | 71.1 /100 | #162 | Good $102,123 |
| English | 70.1 /100 | #163 | Good $102,021 |
| Immigrants | Morocco | 70.0 /100 | #164 | Good $102,015 |
| Immigrants | Albania | 69.4 /100 | #165 | Good $101,957 |
| Samoans | 65.3 /100 | #166 | Good $101,580 |
| Czechoslovakians | 63.0 /100 | #167 | Good $101,387 |
| South American Indians | 60.5 /100 | #168 | Good $101,171 |
| Guamanians/Chamorros | 60.5 /100 | #169 | Good $101,170 |
| Slovaks | 58.8 /100 | #170 | Average $101,029 |
| South Americans | 56.4 /100 | #171 | Average $100,837 |
| Immigrants | Uzbekistan | 52.5 /100 | #172 | Average $100,523 |
| Alsatians | 51.4 /100 | #173 | Average $100,435 |
| Welsh | 50.0 /100 | #174 | Average $100,322 |
| Germans | 48.8 /100 | #175 | Average $100,224 |
| Immigrants | Costa Rica | 47.7 /100 | #176 | Average $100,141 |
Demographics Similar to Immigrants from Western Africa by Householder Income Ages 45 - 64 years
In terms of householder income ages 45 - 64 years, the demographic groups most similar to Immigrants from Western Africa are Nicaraguan ($92,554, a difference of 0.18%), Immigrants from Bangladesh ($92,208, a difference of 0.19%), Pennsylvania German ($91,956, a difference of 0.46%), Immigrants from El Salvador ($93,176, a difference of 0.86%), and Immigrants from Ecuador ($91,462, a difference of 1.0%).
| Demographics | Rating | Rank | Householder Income Ages 45 - 64 years |
| Vietnamese | 3.6 /100 | #229 | Tragic $93,788 |
| Immigrants | Sudan | 3.6 /100 | #230 | Tragic $93,781 |
| Ecuadorians | 3.6 /100 | #231 | Tragic $93,739 |
| Sudanese | 3.5 /100 | #232 | Tragic $93,718 |
| Nepalese | 3.0 /100 | #233 | Tragic $93,355 |
| Immigrants | El Salvador | 2.7 /100 | #234 | Tragic $93,176 |
| Nicaraguans | 2.0 /100 | #235 | Tragic $92,554 |
| Immigrants | Western Africa | 1.8 /100 | #236 | Tragic $92,384 |
| Immigrants | Bangladesh | 1.7 /100 | #237 | Tragic $92,208 |
| Pennsylvania Germans | 1.5 /100 | #238 | Tragic $91,956 |
| Immigrants | Ecuador | 1.2 /100 | #239 | Tragic $91,462 |
| Immigrants | Burma/Myanmar | 1.1 /100 | #240 | Tragic $91,385 |
| Trinidadians and Tobagonians | 1.1 /100 | #241 | Tragic $91,357 |
| Inupiat | 1.1 /100 | #242 | Tragic $91,355 |
| Immigrants | Trinidad and Tobago | 1.1 /100 | #243 | Tragic $91,347 |