Immigrants from Malaysia vs Immigrants from Peru Householder Income Ages 45 - 64 years
COMPARE
Immigrants from Malaysia
Immigrants from Peru
Householder Income Ages 45 - 64 years
Householder Income Ages 45 - 64 years Comparison
Immigrants from Malaysia
Immigrants from Peru
$112,796
HOUSEHOLDER INCOME AGES 45 - 64 YEARS
99.8/ 100
METRIC RATING
52nd/ 347
METRIC RANK
$103,173
HOUSEHOLDER INCOME AGES 45 - 64 YEARS
80.7/ 100
METRIC RATING
150th/ 347
METRIC RANK
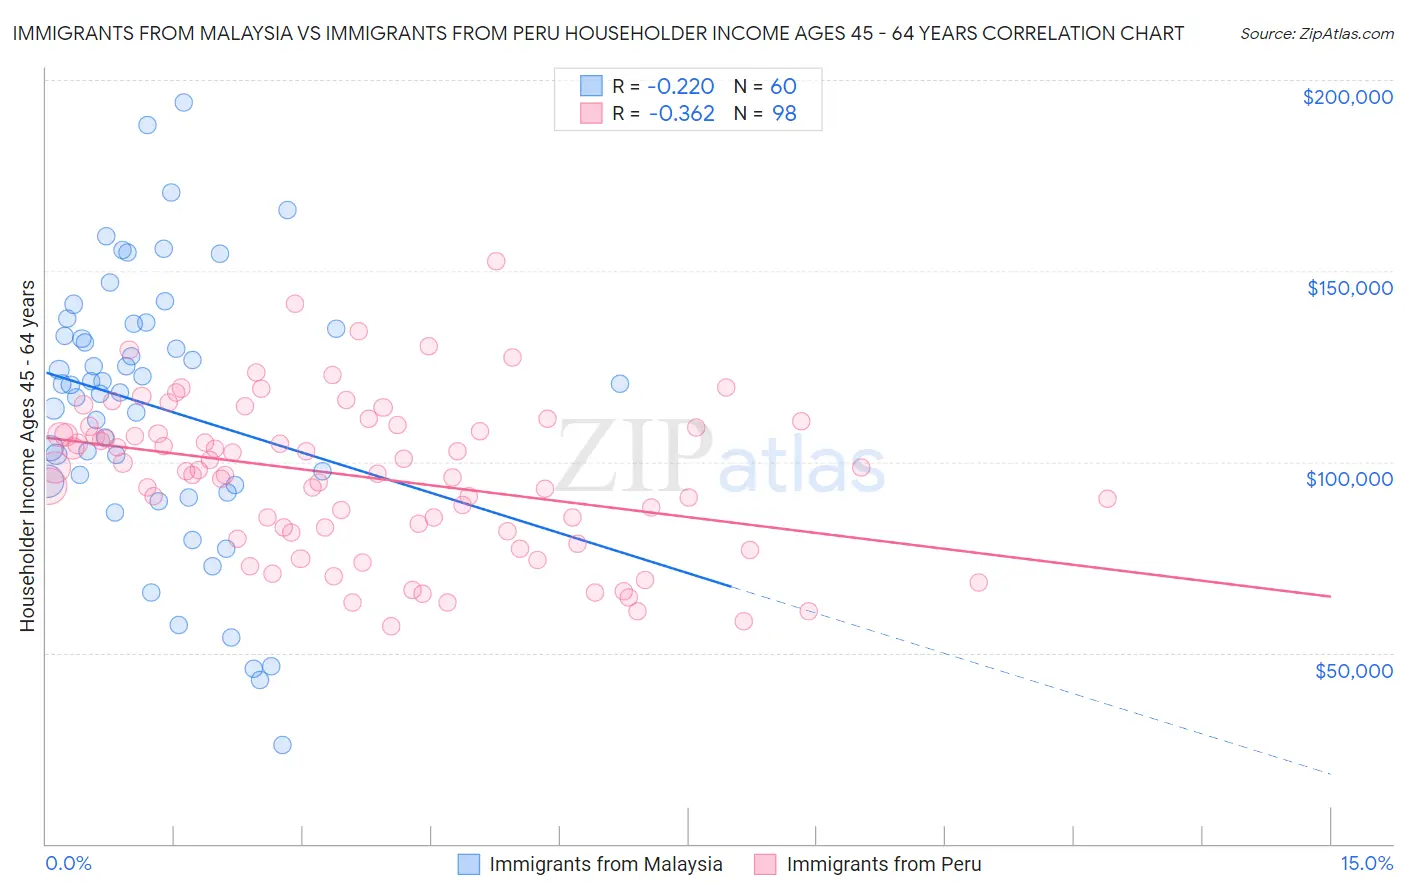
Immigrants from Malaysia vs Immigrants from Peru Householder Income Ages 45 - 64 years Correlation Chart
The statistical analysis conducted on geographies consisting of 197,847,367 people shows a weak negative correlation between the proportion of Immigrants from Malaysia and household income with householder between the ages 45 and 64 in the United States with a correlation coefficient (R) of -0.220 and weighted average of $112,796. Similarly, the statistical analysis conducted on geographies consisting of 328,568,384 people shows a mild negative correlation between the proportion of Immigrants from Peru and household income with householder between the ages 45 and 64 in the United States with a correlation coefficient (R) of -0.362 and weighted average of $103,173, a difference of 9.3%.
Householder Income Ages 45 - 64 years Correlation Summary
| Measurement | Immigrants from Malaysia | Immigrants from Peru |
| Minimum | $25,952 | $56,875 |
| Maximum | $194,219 | $152,612 |
| Range | $168,267 | $95,737 |
| Mean | $114,501 | $96,084 |
| Median | $120,322 | $97,801 |
| Interquartile 25% (IQ1) | $94,457 | $81,677 |
| Interquartile 75% (IQ3) | $135,508 | $109,063 |
| Interquartile Range (IQR) | $41,051 | $27,386 |
| Standard Deviation (Sample) | $35,239 | $20,026 |
| Standard Deviation (Population) | $34,945 | $19,924 |
Similar Demographics by Householder Income Ages 45 - 64 years
Demographics Similar to Immigrants from Malaysia by Householder Income Ages 45 - 64 years
In terms of householder income ages 45 - 64 years, the demographic groups most similar to Immigrants from Malaysia are Immigrants from South Africa ($112,886, a difference of 0.080%), Afghan ($112,676, a difference of 0.11%), Greek ($112,630, a difference of 0.15%), Lithuanian ($112,484, a difference of 0.28%), and Immigrants from Austria ($113,140, a difference of 0.30%).
| Demographics | Rating | Rank | Householder Income Ages 45 - 64 years |
| Immigrants | France | 99.9 /100 | #45 | Exceptional $113,680 |
| Immigrants | Greece | 99.9 /100 | #46 | Exceptional $113,548 |
| Australians | 99.9 /100 | #47 | Exceptional $113,533 |
| Immigrants | Indonesia | 99.9 /100 | #48 | Exceptional $113,519 |
| Immigrants | Russia | 99.8 /100 | #49 | Exceptional $113,215 |
| Immigrants | Austria | 99.8 /100 | #50 | Exceptional $113,140 |
| Immigrants | South Africa | 99.8 /100 | #51 | Exceptional $112,886 |
| Immigrants | Malaysia | 99.8 /100 | #52 | Exceptional $112,796 |
| Afghans | 99.8 /100 | #53 | Exceptional $112,676 |
| Greeks | 99.8 /100 | #54 | Exceptional $112,630 |
| Lithuanians | 99.8 /100 | #55 | Exceptional $112,484 |
| Egyptians | 99.7 /100 | #56 | Exceptional $112,256 |
| Immigrants | Scotland | 99.7 /100 | #57 | Exceptional $112,175 |
| Soviet Union | 99.7 /100 | #58 | Exceptional $112,008 |
| Immigrants | Europe | 99.7 /100 | #59 | Exceptional $111,984 |
Demographics Similar to Immigrants from Peru by Householder Income Ages 45 - 64 years
In terms of householder income ages 45 - 64 years, the demographic groups most similar to Immigrants from Peru are Immigrants from Sierra Leone ($103,227, a difference of 0.050%), Swiss ($103,071, a difference of 0.10%), Irish ($103,067, a difference of 0.10%), Immigrants from Germany ($103,282, a difference of 0.11%), and Scandinavian ($102,969, a difference of 0.20%).
| Demographics | Rating | Rank | Householder Income Ages 45 - 64 years |
| Serbians | 83.2 /100 | #143 | Excellent $103,522 |
| Czechs | 83.1 /100 | #144 | Excellent $103,507 |
| Ugandans | 82.9 /100 | #145 | Excellent $103,472 |
| Immigrants | Chile | 82.5 /100 | #146 | Excellent $103,412 |
| Basques | 82.3 /100 | #147 | Excellent $103,387 |
| Immigrants | Germany | 81.5 /100 | #148 | Excellent $103,282 |
| Immigrants | Sierra Leone | 81.1 /100 | #149 | Excellent $103,227 |
| Immigrants | Peru | 80.7 /100 | #150 | Excellent $103,173 |
| Swiss | 79.9 /100 | #151 | Good $103,071 |
| Irish | 79.8 /100 | #152 | Good $103,067 |
| Scandinavians | 79.0 /100 | #153 | Good $102,969 |
| Slovenes | 78.3 /100 | #154 | Good $102,885 |
| Costa Ricans | 77.4 /100 | #155 | Good $102,779 |
| Carpatho Rusyns | 77.4 /100 | #156 | Good $102,777 |
| Immigrants | Ethiopia | 77.3 /100 | #157 | Good $102,763 |