Greek vs Kenyan Disability Age 18 to 34
COMPARE
Greek
Kenyan
Disability Age 18 to 34
Disability Age 18 to 34 Comparison
Greeks
Kenyans
6.8%
DISABILITY AGE 18 TO 34
16.1/ 100
METRIC RATING
201st/ 347
METRIC RANK
6.8%
DISABILITY AGE 18 TO 34
18.3/ 100
METRIC RATING
199th/ 347
METRIC RANK
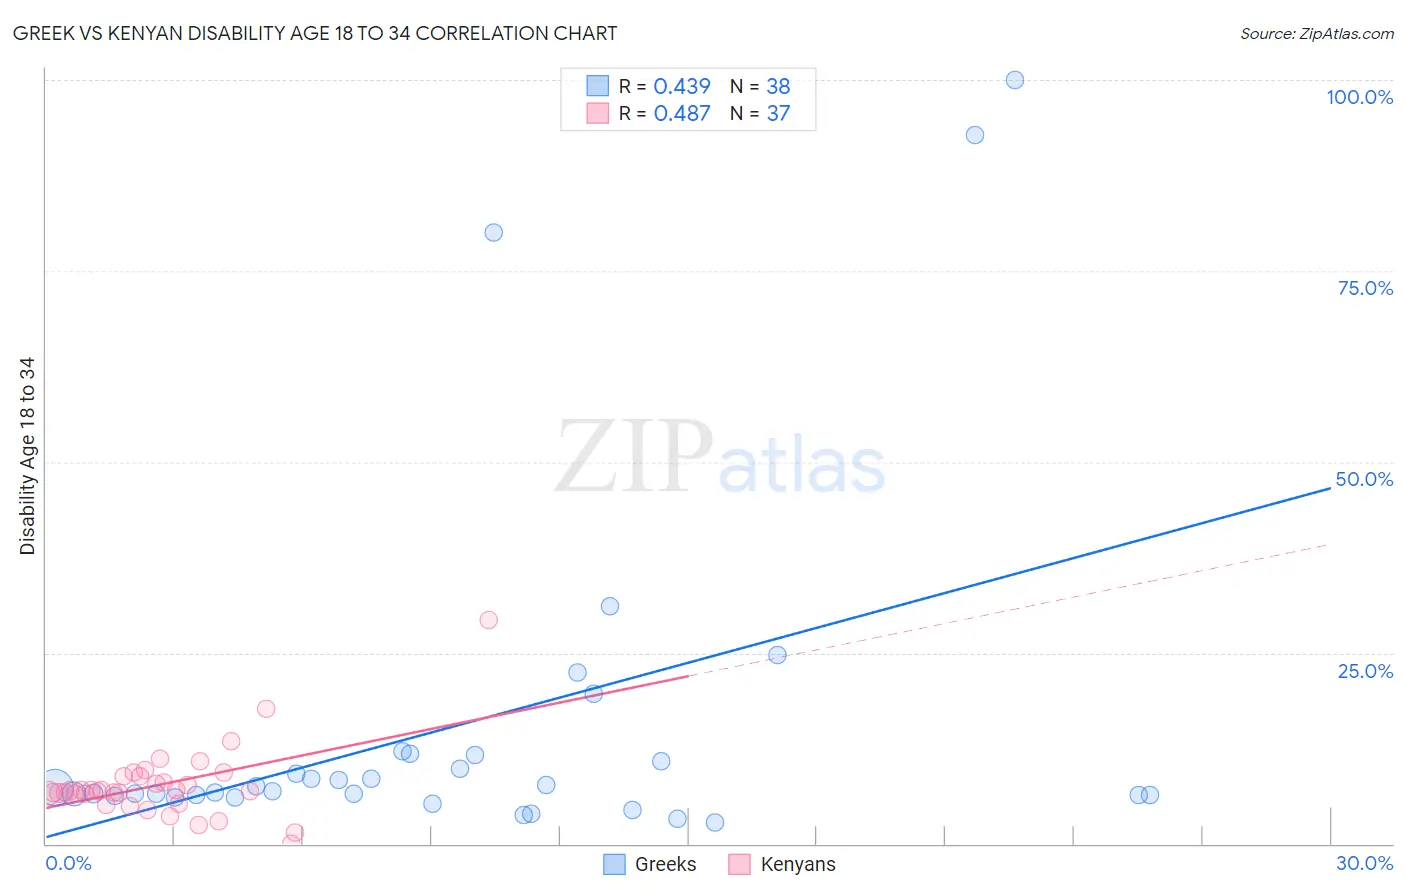
Greek vs Kenyan Disability Age 18 to 34 Correlation Chart
The statistical analysis conducted on geographies consisting of 480,826,659 people shows a moderate positive correlation between the proportion of Greeks and percentage of population with a disability between the ages 18 and 35 in the United States with a correlation coefficient (R) of 0.439 and weighted average of 6.8%. Similarly, the statistical analysis conducted on geographies consisting of 168,169,697 people shows a moderate positive correlation between the proportion of Kenyans and percentage of population with a disability between the ages 18 and 35 in the United States with a correlation coefficient (R) of 0.487 and weighted average of 6.8%, a difference of 0.26%.
Disability Age 18 to 34 Correlation Summary
| Measurement | Greek | Kenyan |
| Minimum | 2.8% | 0.064% |
| Maximum | 100.0% | 29.2% |
| Range | 97.2% | 29.2% |
| Mean | 15.6% | 7.7% |
| Median | 7.1% | 6.9% |
| Interquartile 25% (IQ1) | 6.4% | 5.9% |
| Interquartile 75% (IQ3) | 11.7% | 8.8% |
| Interquartile Range (IQR) | 5.3% | 2.9% |
| Standard Deviation (Sample) | 23.3% | 4.8% |
| Standard Deviation (Population) | 23.0% | 4.7% |
Demographics Similar to Greeks and Kenyans by Disability Age 18 to 34
In terms of disability age 18 to 34, the demographic groups most similar to Greeks are Panamanian (6.8%, a difference of 0.040%), Sierra Leonean (6.8%, a difference of 0.17%), Hispanic or Latino (6.8%, a difference of 0.30%), Immigrants from Bosnia and Herzegovina (6.8%, a difference of 0.33%), and Lebanese (6.8%, a difference of 0.38%). Similarly, the demographic groups most similar to Kenyans are Sierra Leonean (6.8%, a difference of 0.090%), Australian (6.8%, a difference of 0.13%), Estonian (6.8%, a difference of 0.25%), Immigrants from Netherlands (6.7%, a difference of 0.29%), and Panamanian (6.8%, a difference of 0.30%).
| Demographics | Rating | Rank | Disability Age 18 to 34 |
| Immigrants | Zimbabwe | 33.6 /100 | #190 | Fair 6.7% |
| Immigrants | Eastern Africa | 33.2 /100 | #191 | Fair 6.7% |
| Immigrants | Western Africa | 28.3 /100 | #192 | Fair 6.7% |
| Immigrants | Uganda | 25.1 /100 | #193 | Fair 6.7% |
| Immigrants | Sudan | 24.9 /100 | #194 | Fair 6.7% |
| Mexican American Indians | 22.3 /100 | #195 | Fair 6.7% |
| Immigrants | Netherlands | 21.0 /100 | #196 | Fair 6.7% |
| Estonians | 20.6 /100 | #197 | Fair 6.8% |
| Australians | 19.4 /100 | #198 | Poor 6.8% |
| Kenyans | 18.3 /100 | #199 | Poor 6.8% |
| Sierra Leoneans | 17.5 /100 | #200 | Poor 6.8% |
| Greeks | 16.1 /100 | #201 | Poor 6.8% |
| Panamanians | 15.8 /100 | #202 | Poor 6.8% |
| Hispanics or Latinos | 13.8 /100 | #203 | Poor 6.8% |
| Immigrants | Bosnia and Herzegovina | 13.6 /100 | #204 | Poor 6.8% |
| Lebanese | 13.3 /100 | #205 | Poor 6.8% |
| Japanese | 12.8 /100 | #206 | Poor 6.8% |
| Mexicans | 12.6 /100 | #207 | Poor 6.8% |
| Immigrants | Scotland | 12.4 /100 | #208 | Poor 6.8% |
| Immigrants | Burma/Myanmar | 12.3 /100 | #209 | Poor 6.8% |
| Latvians | 11.1 /100 | #210 | Poor 6.8% |