Greek vs Navajo Householder Income Ages 45 - 64 years
COMPARE
Greek
Navajo
Householder Income Ages 45 - 64 years
Householder Income Ages 45 - 64 years Comparison
Greeks
Navajo
$112,630
HOUSEHOLDER INCOME AGES 45 - 64 YEARS
99.8/ 100
METRIC RATING
54th/ 347
METRIC RANK
$69,759
HOUSEHOLDER INCOME AGES 45 - 64 YEARS
0.0/ 100
METRIC RATING
345th/ 347
METRIC RANK
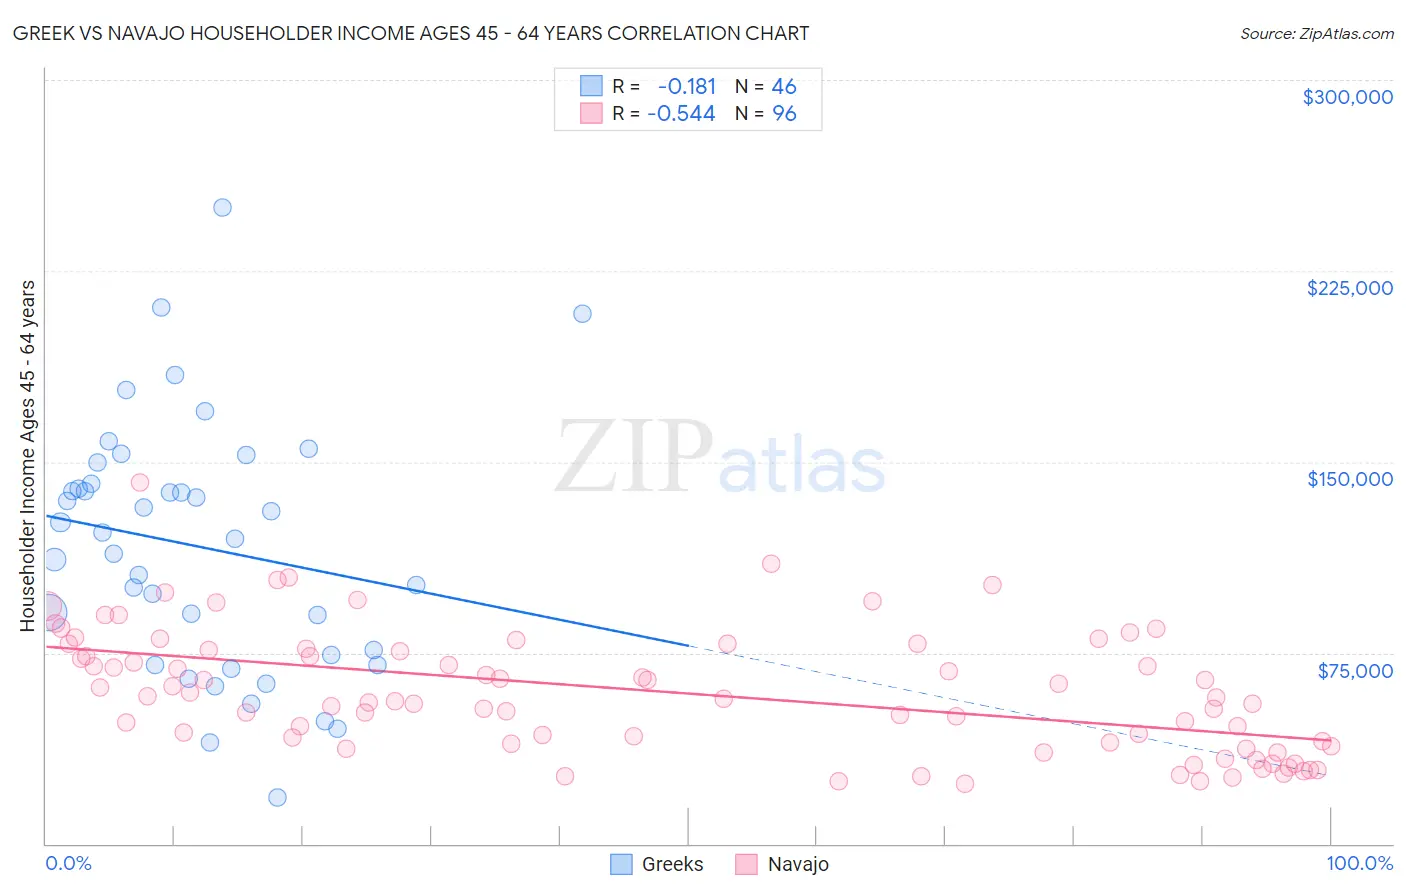
Greek vs Navajo Householder Income Ages 45 - 64 years Correlation Chart
The statistical analysis conducted on geographies consisting of 481,485,565 people shows a poor negative correlation between the proportion of Greeks and household income with householder between the ages 45 and 64 in the United States with a correlation coefficient (R) of -0.181 and weighted average of $112,630. Similarly, the statistical analysis conducted on geographies consisting of 224,499,663 people shows a substantial negative correlation between the proportion of Navajo and household income with householder between the ages 45 and 64 in the United States with a correlation coefficient (R) of -0.544 and weighted average of $69,759, a difference of 61.5%.
Householder Income Ages 45 - 64 years Correlation Summary
| Measurement | Greek | Navajo |
| Minimum | $18,083 | $23,688 |
| Maximum | $250,001 | $142,006 |
| Range | $231,918 | $118,318 |
| Mean | $116,578 | $59,518 |
| Median | $121,059 | $57,088 |
| Interquartile 25% (IQ1) | $74,375 | $39,664 |
| Interquartile 75% (IQ3) | $141,576 | $76,283 |
| Interquartile Range (IQR) | $67,201 | $36,618 |
| Standard Deviation (Sample) | $49,084 | $24,055 |
| Standard Deviation (Population) | $48,548 | $23,929 |
Similar Demographics by Householder Income Ages 45 - 64 years
Demographics Similar to Greeks by Householder Income Ages 45 - 64 years
In terms of householder income ages 45 - 64 years, the demographic groups most similar to Greeks are Afghan ($112,676, a difference of 0.040%), Lithuanian ($112,484, a difference of 0.13%), Immigrants from Malaysia ($112,796, a difference of 0.15%), Immigrants from South Africa ($112,886, a difference of 0.23%), and Egyptian ($112,256, a difference of 0.33%).
| Demographics | Rating | Rank | Householder Income Ages 45 - 64 years |
| Australians | 99.9 /100 | #47 | Exceptional $113,533 |
| Immigrants | Indonesia | 99.9 /100 | #48 | Exceptional $113,519 |
| Immigrants | Russia | 99.8 /100 | #49 | Exceptional $113,215 |
| Immigrants | Austria | 99.8 /100 | #50 | Exceptional $113,140 |
| Immigrants | South Africa | 99.8 /100 | #51 | Exceptional $112,886 |
| Immigrants | Malaysia | 99.8 /100 | #52 | Exceptional $112,796 |
| Afghans | 99.8 /100 | #53 | Exceptional $112,676 |
| Greeks | 99.8 /100 | #54 | Exceptional $112,630 |
| Lithuanians | 99.8 /100 | #55 | Exceptional $112,484 |
| Egyptians | 99.7 /100 | #56 | Exceptional $112,256 |
| Immigrants | Scotland | 99.7 /100 | #57 | Exceptional $112,175 |
| Soviet Union | 99.7 /100 | #58 | Exceptional $112,008 |
| Immigrants | Europe | 99.7 /100 | #59 | Exceptional $111,984 |
| Immigrants | Netherlands | 99.7 /100 | #60 | Exceptional $111,982 |
| Immigrants | Czechoslovakia | 99.7 /100 | #61 | Exceptional $111,914 |
Demographics Similar to Navajo by Householder Income Ages 45 - 64 years
In terms of householder income ages 45 - 64 years, the demographic groups most similar to Navajo are Puerto Rican ($69,234, a difference of 0.76%), Houma ($72,093, a difference of 3.4%), Pima ($73,365, a difference of 5.2%), Tohono O'odham ($73,774, a difference of 5.8%), and Crow ($74,257, a difference of 6.5%).
| Demographics | Rating | Rank | Householder Income Ages 45 - 64 years |
| Immigrants | Congo | 0.0 /100 | #333 | Tragic $77,850 |
| Menominee | 0.0 /100 | #334 | Tragic $76,903 |
| Cheyenne | 0.0 /100 | #335 | Tragic $76,362 |
| Arapaho | 0.0 /100 | #336 | Tragic $75,945 |
| Pueblo | 0.0 /100 | #337 | Tragic $75,601 |
| Hopi | 0.0 /100 | #338 | Tragic $75,562 |
| Kiowa | 0.0 /100 | #339 | Tragic $74,815 |
| Immigrants | Yemen | 0.0 /100 | #340 | Tragic $74,575 |
| Crow | 0.0 /100 | #341 | Tragic $74,257 |
| Tohono O'odham | 0.0 /100 | #342 | Tragic $73,774 |
| Pima | 0.0 /100 | #343 | Tragic $73,365 |
| Houma | 0.0 /100 | #344 | Tragic $72,093 |
| Navajo | 0.0 /100 | #345 | Tragic $69,759 |
| Puerto Ricans | 0.0 /100 | #346 | Tragic $69,234 |
| Lumbee | 0.0 /100 | #347 | Tragic $65,113 |