Greek vs Creek Unemployment Among Ages 16 to 19 years
COMPARE
Greek
Creek
Unemployment Among Ages 16 to 19 years
Unemployment Among Ages 16 to 19 years Comparison
Greeks
Creek
16.9%
UNEMPLOYMENT AMONG AGES 16 TO 19 YEARS
97.0/ 100
METRIC RATING
87th/ 347
METRIC RANK
17.2%
UNEMPLOYMENT AMONG AGES 16 TO 19 YEARS
85.5/ 100
METRIC RATING
129th/ 347
METRIC RANK
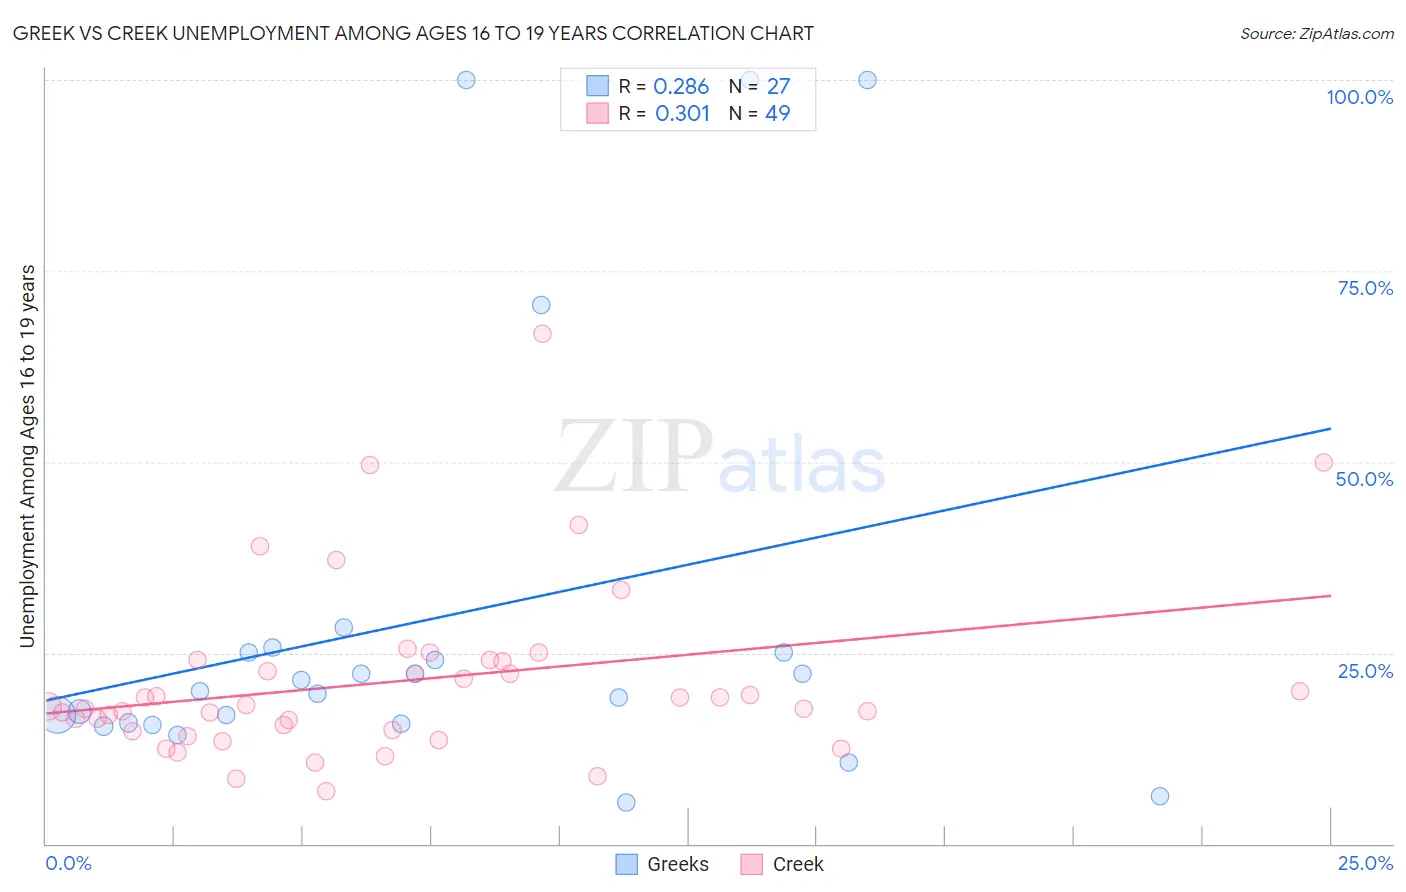
Greek vs Creek Unemployment Among Ages 16 to 19 years Correlation Chart
The statistical analysis conducted on geographies consisting of 447,500,260 people shows a weak positive correlation between the proportion of Greeks and unemployment rate among population between the ages 16 and 19 in the United States with a correlation coefficient (R) of 0.286 and weighted average of 16.9%. Similarly, the statistical analysis conducted on geographies consisting of 173,206,941 people shows a mild positive correlation between the proportion of Creek and unemployment rate among population between the ages 16 and 19 in the United States with a correlation coefficient (R) of 0.301 and weighted average of 17.2%, a difference of 2.1%.
Unemployment Among Ages 16 to 19 years Correlation Summary
| Measurement | Greek | Creek |
| Minimum | 5.5% | 6.8% |
| Maximum | 100.0% | 66.7% |
| Range | 94.5% | 59.9% |
| Mean | 29.5% | 21.3% |
| Median | 19.9% | 17.9% |
| Interquartile 25% (IQ1) | 15.7% | 14.8% |
| Interquartile 75% (IQ3) | 25.1% | 23.9% |
| Interquartile Range (IQR) | 9.4% | 9.1% |
| Standard Deviation (Sample) | 27.8% | 11.5% |
| Standard Deviation (Population) | 27.3% | 11.4% |
Similar Demographics by Unemployment Among Ages 16 to 19 years
Demographics Similar to Greeks by Unemployment Among Ages 16 to 19 years
In terms of unemployment among ages 16 to 19 years, the demographic groups most similar to Greeks are Immigrants from South Africa (16.9%, a difference of 0.060%), Immigrants from Scotland (16.8%, a difference of 0.070%), Immigrants from Kuwait (16.8%, a difference of 0.080%), French (16.8%, a difference of 0.15%), and Canadian (16.9%, a difference of 0.15%).
| Demographics | Rating | Rank | Unemployment Among Ages 16 to 19 years |
| French Canadians | 97.5 /100 | #80 | Exceptional 16.8% |
| Immigrants | Latvia | 97.5 /100 | #81 | Exceptional 16.8% |
| Whites/Caucasians | 97.5 /100 | #82 | Exceptional 16.8% |
| Ugandans | 97.4 /100 | #83 | Exceptional 16.8% |
| French | 97.4 /100 | #84 | Exceptional 16.8% |
| Immigrants | Kuwait | 97.2 /100 | #85 | Exceptional 16.8% |
| Immigrants | Scotland | 97.2 /100 | #86 | Exceptional 16.8% |
| Greeks | 97.0 /100 | #87 | Exceptional 16.9% |
| Immigrants | South Africa | 96.9 /100 | #88 | Exceptional 16.9% |
| Canadians | 96.7 /100 | #89 | Exceptional 16.9% |
| Asians | 96.6 /100 | #90 | Exceptional 16.9% |
| Cambodians | 96.3 /100 | #91 | Exceptional 16.9% |
| South Africans | 95.9 /100 | #92 | Exceptional 16.9% |
| Cubans | 95.8 /100 | #93 | Exceptional 16.9% |
| Bangladeshis | 95.8 /100 | #94 | Exceptional 16.9% |
Demographics Similar to Creek by Unemployment Among Ages 16 to 19 years
In terms of unemployment among ages 16 to 19 years, the demographic groups most similar to Creek are Australian (17.2%, a difference of 0.010%), Pakistani (17.2%, a difference of 0.030%), Immigrants from Indonesia (17.2%, a difference of 0.070%), Immigrants from Bolivia (17.2%, a difference of 0.13%), and German Russian (17.2%, a difference of 0.13%).
| Demographics | Rating | Rank | Unemployment Among Ages 16 to 19 years |
| Immigrants | South Eastern Asia | 90.7 /100 | #122 | Exceptional 17.1% |
| Immigrants | Laos | 88.8 /100 | #123 | Excellent 17.1% |
| Syrians | 88.6 /100 | #124 | Excellent 17.1% |
| Immigrants | Germany | 87.7 /100 | #125 | Excellent 17.2% |
| Immigrants | Bolivia | 86.7 /100 | #126 | Excellent 17.2% |
| Pakistanis | 85.8 /100 | #127 | Excellent 17.2% |
| Australians | 85.6 /100 | #128 | Excellent 17.2% |
| Creek | 85.5 /100 | #129 | Excellent 17.2% |
| Immigrants | Indonesia | 84.7 /100 | #130 | Excellent 17.2% |
| German Russians | 84.1 /100 | #131 | Excellent 17.2% |
| Arabs | 83.9 /100 | #132 | Excellent 17.2% |
| Laotians | 83.9 /100 | #133 | Excellent 17.2% |
| Potawatomi | 83.8 /100 | #134 | Excellent 17.2% |
| Samoans | 83.7 /100 | #135 | Excellent 17.2% |
| Immigrants | Oceania | 83.1 /100 | #136 | Excellent 17.2% |