Greek vs Navajo Median Household Income
COMPARE
Greek
Navajo
Median Household Income
Median Household Income Comparison
Greeks
Navajo
$94,735
MEDIAN HOUSEHOLD INCOME
99.8/ 100
METRIC RATING
63rd/ 347
METRIC RANK
$59,159
MEDIAN HOUSEHOLD INCOME
0.0/ 100
METRIC RATING
346th/ 347
METRIC RANK
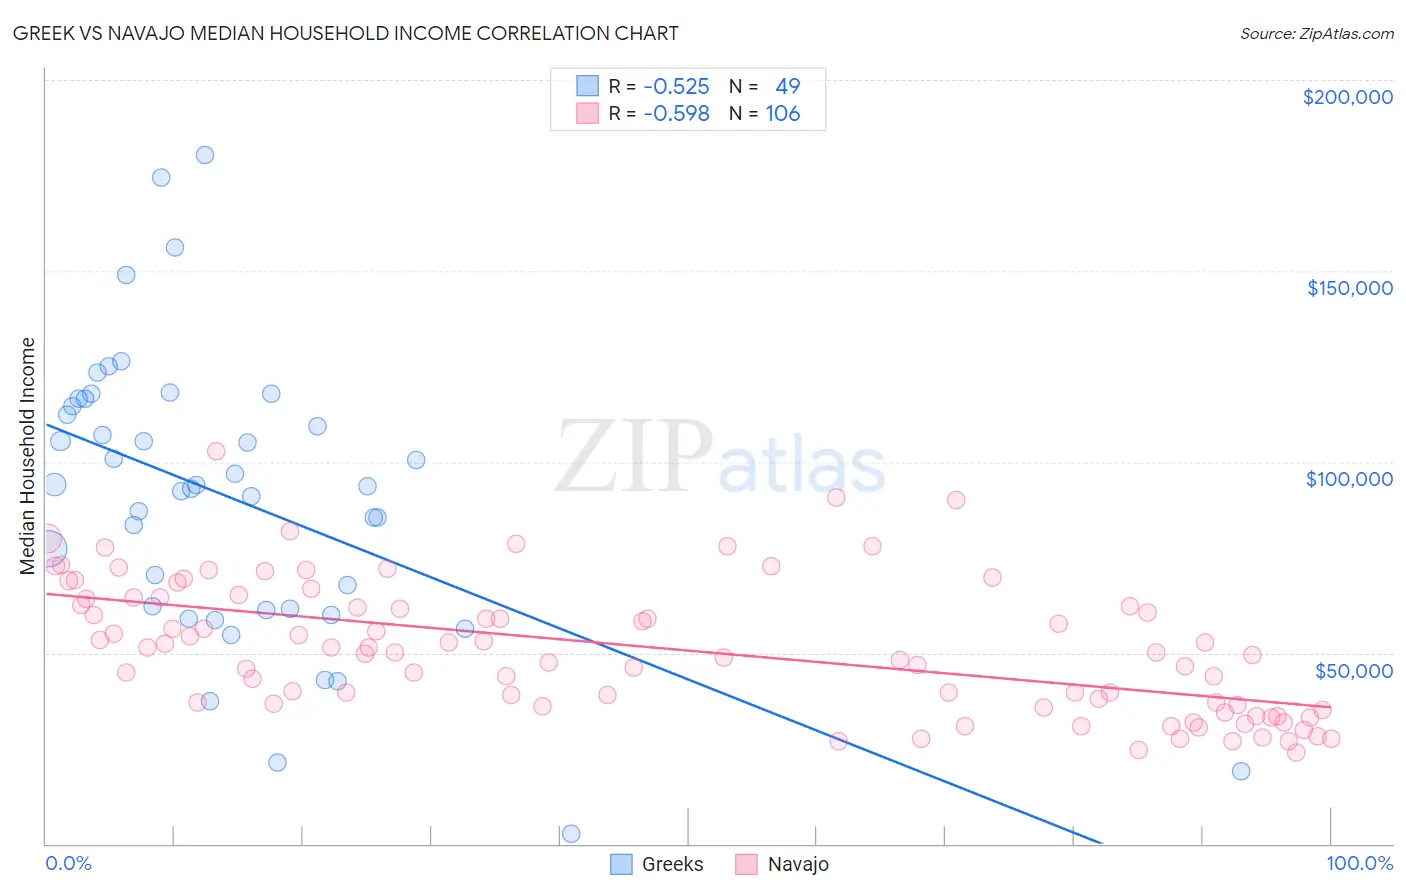
Greek vs Navajo Median Household Income Correlation Chart
The statistical analysis conducted on geographies consisting of 482,222,552 people shows a substantial negative correlation between the proportion of Greeks and median household income in the United States with a correlation coefficient (R) of -0.525 and weighted average of $94,735. Similarly, the statistical analysis conducted on geographies consisting of 224,715,573 people shows a substantial negative correlation between the proportion of Navajo and median household income in the United States with a correlation coefficient (R) of -0.598 and weighted average of $59,159, a difference of 60.1%.
Median Household Income Correlation Summary
| Measurement | Greek | Navajo |
| Minimum | $2,499 | $24,004 |
| Maximum | $180,197 | $102,885 |
| Range | $177,698 | $78,881 |
| Mean | $90,436 | $51,106 |
| Median | $93,750 | $50,167 |
| Interquartile 25% (IQ1) | $61,372 | $36,185 |
| Interquartile 75% (IQ3) | $115,471 | $64,286 |
| Interquartile Range (IQR) | $54,098 | $28,101 |
| Standard Deviation (Sample) | $37,295 | $17,310 |
| Standard Deviation (Population) | $36,913 | $17,228 |
Similar Demographics by Median Household Income
Demographics Similar to Greeks by Median Household Income
In terms of median household income, the demographic groups most similar to Greeks are Immigrants from Norway ($94,846, a difference of 0.12%), Laotian ($94,990, a difference of 0.27%), Korean ($95,018, a difference of 0.30%), Immigrants from Europe ($95,032, a difference of 0.31%), and Immigrants from Netherlands ($94,411, a difference of 0.34%).
| Demographics | Rating | Rank | Median Household Income |
| Immigrants | Austria | 99.9 /100 | #56 | Exceptional $95,277 |
| New Zealanders | 99.8 /100 | #57 | Exceptional $95,146 |
| Soviet Union | 99.8 /100 | #58 | Exceptional $95,098 |
| Immigrants | Europe | 99.8 /100 | #59 | Exceptional $95,032 |
| Koreans | 99.8 /100 | #60 | Exceptional $95,018 |
| Laotians | 99.8 /100 | #61 | Exceptional $94,990 |
| Immigrants | Norway | 99.8 /100 | #62 | Exceptional $94,846 |
| Greeks | 99.8 /100 | #63 | Exceptional $94,735 |
| Immigrants | Netherlands | 99.7 /100 | #64 | Exceptional $94,411 |
| Immigrants | Belarus | 99.7 /100 | #65 | Exceptional $94,399 |
| Immigrants | Romania | 99.7 /100 | #66 | Exceptional $94,222 |
| Immigrants | Scotland | 99.7 /100 | #67 | Exceptional $94,091 |
| Mongolians | 99.7 /100 | #68 | Exceptional $93,971 |
| Argentineans | 99.7 /100 | #69 | Exceptional $93,960 |
| Immigrants | Fiji | 99.7 /100 | #70 | Exceptional $93,933 |
Demographics Similar to Navajo by Median Household Income
In terms of median household income, the demographic groups most similar to Navajo are Puerto Rican ($59,197, a difference of 0.060%), Tohono O'odham ($61,663, a difference of 4.2%), Houma ($62,575, a difference of 5.8%), Pima ($63,262, a difference of 6.9%), and Crow ($63,681, a difference of 7.6%).
| Demographics | Rating | Rank | Median Household Income |
| Creek | 0.0 /100 | #333 | Tragic $67,715 |
| Blacks/African Americans | 0.0 /100 | #334 | Tragic $67,573 |
| Cheyenne | 0.0 /100 | #335 | Tragic $66,974 |
| Immigrants | Congo | 0.0 /100 | #336 | Tragic $66,768 |
| Kiowa | 0.0 /100 | #337 | Tragic $65,914 |
| Immigrants | Yemen | 0.0 /100 | #338 | Tragic $65,194 |
| Hopi | 0.0 /100 | #339 | Tragic $65,043 |
| Pueblo | 0.0 /100 | #340 | Tragic $64,692 |
| Crow | 0.0 /100 | #341 | Tragic $63,681 |
| Pima | 0.0 /100 | #342 | Tragic $63,262 |
| Houma | 0.0 /100 | #343 | Tragic $62,575 |
| Tohono O'odham | 0.0 /100 | #344 | Tragic $61,663 |
| Puerto Ricans | 0.0 /100 | #345 | Tragic $59,197 |
| Navajo | 0.0 /100 | #346 | Tragic $59,159 |
| Lumbee | 0.0 /100 | #347 | Tragic $54,644 |