Ghanaian vs Yakama Median Male Earnings
COMPARE
Ghanaian
Yakama
Median Male Earnings
Median Male Earnings Comparison
Ghanaians
Yakama
$52,810
MEDIAN MALE EARNINGS
16.1/ 100
METRIC RATING
204th/ 347
METRIC RANK
$45,002
MEDIAN MALE EARNINGS
0.0/ 100
METRIC RATING
329th/ 347
METRIC RANK
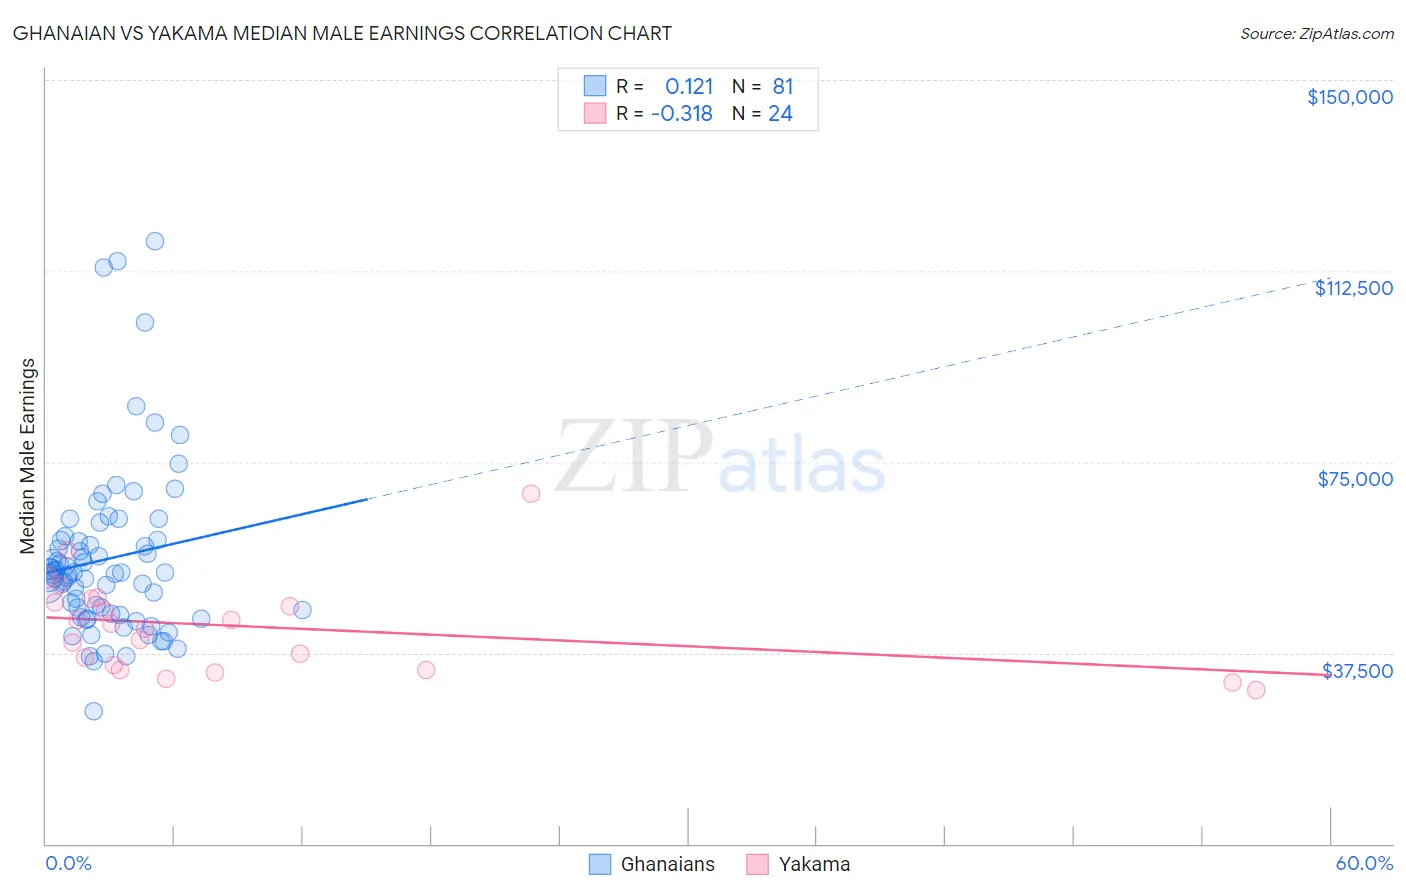
Ghanaian vs Yakama Median Male Earnings Correlation Chart
The statistical analysis conducted on geographies consisting of 190,703,925 people shows a poor positive correlation between the proportion of Ghanaians and median male earnings in the United States with a correlation coefficient (R) of 0.121 and weighted average of $52,810. Similarly, the statistical analysis conducted on geographies consisting of 19,920,033 people shows a mild negative correlation between the proportion of Yakama and median male earnings in the United States with a correlation coefficient (R) of -0.318 and weighted average of $45,002, a difference of 17.3%.
Median Male Earnings Correlation Summary
| Measurement | Ghanaian | Yakama |
| Minimum | $26,089 | $30,179 |
| Maximum | $118,333 | $68,750 |
| Range | $92,244 | $38,571 |
| Mean | $55,935 | $42,657 |
| Median | $53,206 | $42,664 |
| Interquartile 25% (IQ1) | $44,949 | $34,669 |
| Interquartile 75% (IQ3) | $59,627 | $47,788 |
| Interquartile Range (IQR) | $14,678 | $13,119 |
| Standard Deviation (Sample) | $16,875 | $9,142 |
| Standard Deviation (Population) | $16,771 | $8,950 |
Similar Demographics by Median Male Earnings
Demographics Similar to Ghanaians by Median Male Earnings
In terms of median male earnings, the demographic groups most similar to Ghanaians are Panamanian ($52,835, a difference of 0.050%), Immigrants from Uruguay ($52,860, a difference of 0.10%), Immigrants from Bosnia and Herzegovina ($52,869, a difference of 0.11%), Immigrants from Colombia ($52,725, a difference of 0.16%), and Immigrants from Thailand ($52,908, a difference of 0.19%).
| Demographics | Rating | Rank | Median Male Earnings |
| Immigrants | Kenya | 26.0 /100 | #197 | Fair $53,427 |
| Immigrants | Costa Rica | 22.6 /100 | #198 | Fair $53,237 |
| Tongans | 22.3 /100 | #199 | Fair $53,218 |
| Immigrants | Thailand | 17.5 /100 | #200 | Poor $52,908 |
| Immigrants | Bosnia and Herzegovina | 16.9 /100 | #201 | Poor $52,869 |
| Immigrants | Uruguay | 16.8 /100 | #202 | Poor $52,860 |
| Panamanians | 16.5 /100 | #203 | Poor $52,835 |
| Ghanaians | 16.1 /100 | #204 | Poor $52,810 |
| Immigrants | Colombia | 15.0 /100 | #205 | Poor $52,725 |
| Immigrants | Iraq | 14.5 /100 | #206 | Poor $52,681 |
| Vietnamese | 12.7 /100 | #207 | Poor $52,525 |
| Venezuelans | 12.5 /100 | #208 | Poor $52,510 |
| Bermudans | 12.1 /100 | #209 | Poor $52,465 |
| Delaware | 11.5 /100 | #210 | Poor $52,412 |
| Tlingit-Haida | 11.5 /100 | #211 | Poor $52,409 |
Demographics Similar to Yakama by Median Male Earnings
In terms of median male earnings, the demographic groups most similar to Yakama are Immigrants from Mexico ($44,960, a difference of 0.090%), Kiowa ($45,094, a difference of 0.20%), Immigrants from Bahamas ($45,176, a difference of 0.39%), Native/Alaskan ($44,775, a difference of 0.51%), and Bahamian ($44,756, a difference of 0.55%).
| Demographics | Rating | Rank | Median Male Earnings |
| Sioux | 0.0 /100 | #322 | Tragic $45,566 |
| Immigrants | Central America | 0.0 /100 | #323 | Tragic $45,538 |
| Blacks/African Americans | 0.0 /100 | #324 | Tragic $45,523 |
| Yuman | 0.0 /100 | #325 | Tragic $45,446 |
| Immigrants | Haiti | 0.0 /100 | #326 | Tragic $45,266 |
| Immigrants | Bahamas | 0.0 /100 | #327 | Tragic $45,176 |
| Kiowa | 0.0 /100 | #328 | Tragic $45,094 |
| Yakama | 0.0 /100 | #329 | Tragic $45,002 |
| Immigrants | Mexico | 0.0 /100 | #330 | Tragic $44,960 |
| Natives/Alaskans | 0.0 /100 | #331 | Tragic $44,775 |
| Bahamians | 0.0 /100 | #332 | Tragic $44,756 |
| Immigrants | Congo | 0.0 /100 | #333 | Tragic $44,204 |
| Immigrants | Yemen | 0.0 /100 | #334 | Tragic $44,083 |
| Spanish American Indians | 0.0 /100 | #335 | Tragic $44,010 |
| Immigrants | Cuba | 0.0 /100 | #336 | Tragic $43,461 |