Ghanaian vs Immigrants from Thailand Median Male Earnings
COMPARE
Ghanaian
Immigrants from Thailand
Median Male Earnings
Median Male Earnings Comparison
Ghanaians
Immigrants from Thailand
$52,810
MEDIAN MALE EARNINGS
16.1/ 100
METRIC RATING
204th/ 347
METRIC RANK
$52,908
MEDIAN MALE EARNINGS
17.5/ 100
METRIC RATING
200th/ 347
METRIC RANK
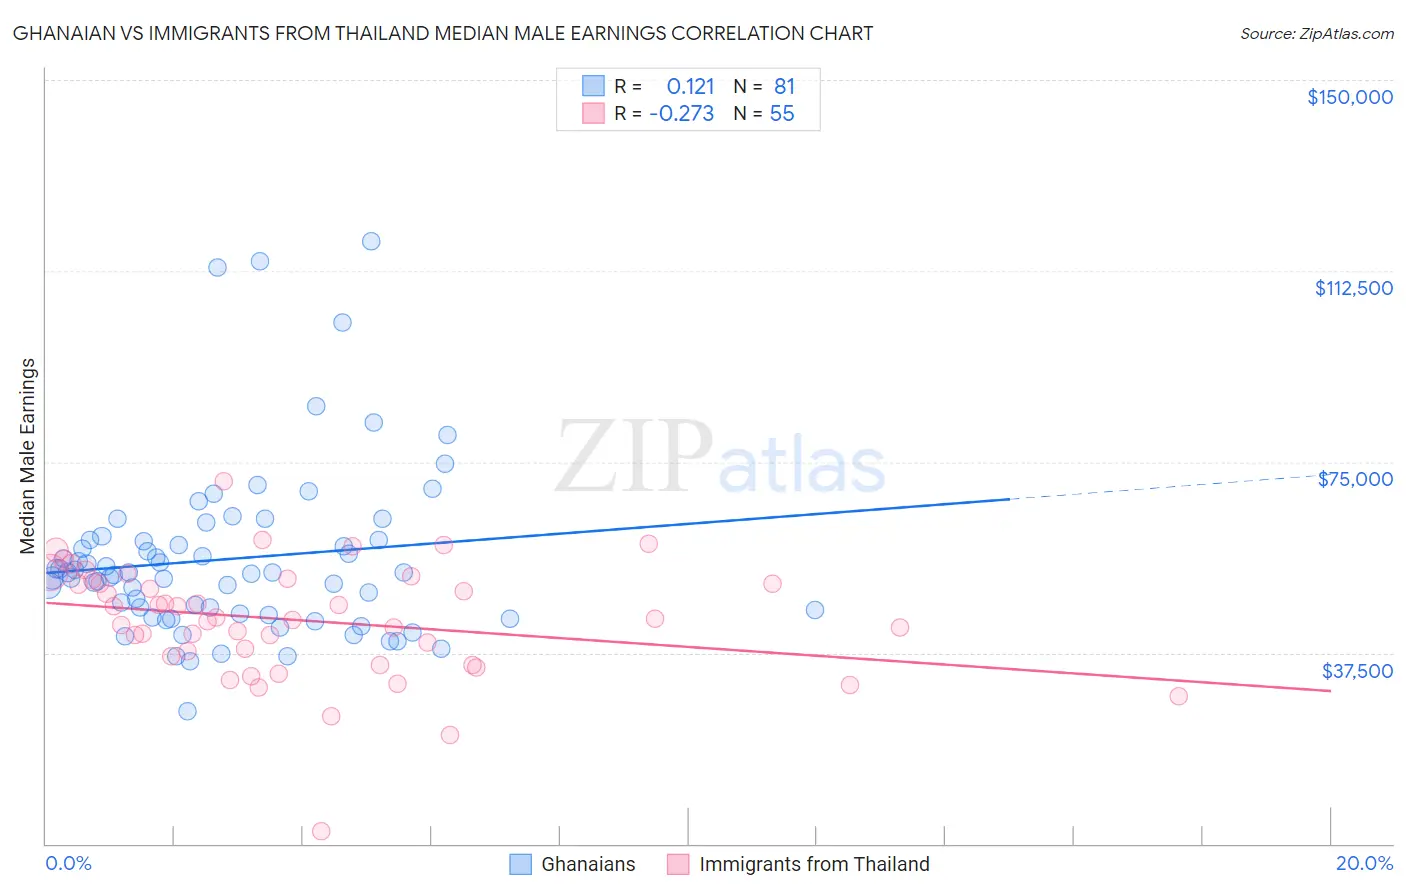
Ghanaian vs Immigrants from Thailand Median Male Earnings Correlation Chart
The statistical analysis conducted on geographies consisting of 190,703,925 people shows a poor positive correlation between the proportion of Ghanaians and median male earnings in the United States with a correlation coefficient (R) of 0.121 and weighted average of $52,810. Similarly, the statistical analysis conducted on geographies consisting of 316,970,143 people shows a weak negative correlation between the proportion of Immigrants from Thailand and median male earnings in the United States with a correlation coefficient (R) of -0.273 and weighted average of $52,908, a difference of 0.19%.
Median Male Earnings Correlation Summary
| Measurement | Ghanaian | Immigrants from Thailand |
| Minimum | $26,089 | $2,499 |
| Maximum | $118,333 | $71,169 |
| Range | $92,244 | $68,670 |
| Mean | $55,935 | $43,857 |
| Median | $53,206 | $44,188 |
| Interquartile 25% (IQ1) | $44,949 | $36,813 |
| Interquartile 75% (IQ3) | $59,627 | $51,857 |
| Interquartile Range (IQR) | $14,678 | $15,045 |
| Standard Deviation (Sample) | $16,875 | $11,370 |
| Standard Deviation (Population) | $16,771 | $11,266 |
Demographics Similar to Ghanaians and Immigrants from Thailand by Median Male Earnings
In terms of median male earnings, the demographic groups most similar to Ghanaians are Panamanian ($52,835, a difference of 0.050%), Immigrants from Uruguay ($52,860, a difference of 0.10%), Immigrants from Bosnia and Herzegovina ($52,869, a difference of 0.11%), Immigrants from Colombia ($52,725, a difference of 0.16%), and Immigrants from Iraq ($52,681, a difference of 0.24%). Similarly, the demographic groups most similar to Immigrants from Thailand are Immigrants from Bosnia and Herzegovina ($52,869, a difference of 0.070%), Immigrants from Uruguay ($52,860, a difference of 0.090%), Panamanian ($52,835, a difference of 0.14%), Immigrants from Colombia ($52,725, a difference of 0.35%), and Immigrants from Iraq ($52,681, a difference of 0.43%).
| Demographics | Rating | Rank | Median Male Earnings |
| Scotch-Irish | 30.6 /100 | #192 | Fair $53,658 |
| Kenyans | 30.4 /100 | #193 | Fair $53,647 |
| Spanish | 29.0 /100 | #194 | Fair $53,576 |
| Immigrants | Azores | 27.5 /100 | #195 | Fair $53,503 |
| Immigrants | Africa | 26.6 /100 | #196 | Fair $53,457 |
| Immigrants | Kenya | 26.0 /100 | #197 | Fair $53,427 |
| Immigrants | Costa Rica | 22.6 /100 | #198 | Fair $53,237 |
| Tongans | 22.3 /100 | #199 | Fair $53,218 |
| Immigrants | Thailand | 17.5 /100 | #200 | Poor $52,908 |
| Immigrants | Bosnia and Herzegovina | 16.9 /100 | #201 | Poor $52,869 |
| Immigrants | Uruguay | 16.8 /100 | #202 | Poor $52,860 |
| Panamanians | 16.5 /100 | #203 | Poor $52,835 |
| Ghanaians | 16.1 /100 | #204 | Poor $52,810 |
| Immigrants | Colombia | 15.0 /100 | #205 | Poor $52,725 |
| Immigrants | Iraq | 14.5 /100 | #206 | Poor $52,681 |
| Vietnamese | 12.7 /100 | #207 | Poor $52,525 |
| Venezuelans | 12.5 /100 | #208 | Poor $52,510 |
| Bermudans | 12.1 /100 | #209 | Poor $52,465 |
| Delaware | 11.5 /100 | #210 | Poor $52,412 |
| Tlingit-Haida | 11.5 /100 | #211 | Poor $52,409 |
| Cajuns | 10.7 /100 | #212 | Poor $52,325 |