Immigrants from Barbados vs Yakama Median Male Earnings
COMPARE
Immigrants from Barbados
Yakama
Median Male Earnings
Median Male Earnings Comparison
Immigrants from Barbados
Yakama
$50,795
MEDIAN MALE EARNINGS
2.6/ 100
METRIC RATING
237th/ 347
METRIC RANK
$45,002
MEDIAN MALE EARNINGS
0.0/ 100
METRIC RATING
329th/ 347
METRIC RANK
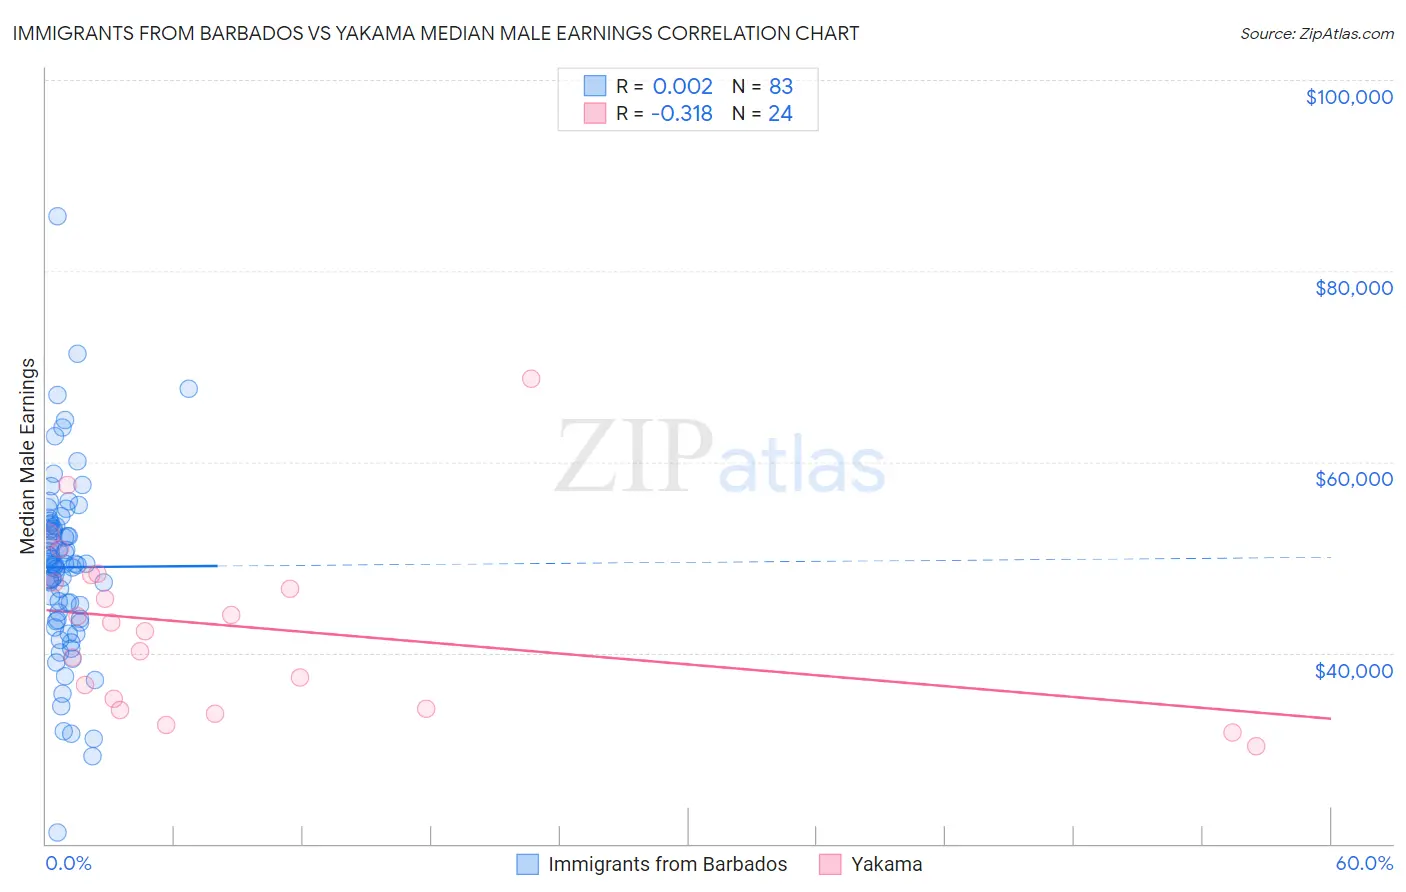
Immigrants from Barbados vs Yakama Median Male Earnings Correlation Chart
The statistical analysis conducted on geographies consisting of 112,696,118 people shows no correlation between the proportion of Immigrants from Barbados and median male earnings in the United States with a correlation coefficient (R) of 0.002 and weighted average of $50,795. Similarly, the statistical analysis conducted on geographies consisting of 19,920,033 people shows a mild negative correlation between the proportion of Yakama and median male earnings in the United States with a correlation coefficient (R) of -0.318 and weighted average of $45,002, a difference of 12.9%.
Median Male Earnings Correlation Summary
| Measurement | Immigrants from Barbados | Yakama |
| Minimum | $21,184 | $30,179 |
| Maximum | $85,682 | $68,750 |
| Range | $64,498 | $38,571 |
| Mean | $48,967 | $42,657 |
| Median | $49,260 | $42,664 |
| Interquartile 25% (IQ1) | $43,464 | $34,669 |
| Interquartile 75% (IQ3) | $53,363 | $47,788 |
| Interquartile Range (IQR) | $9,899 | $13,119 |
| Standard Deviation (Sample) | $9,605 | $9,142 |
| Standard Deviation (Population) | $9,547 | $8,950 |
Similar Demographics by Median Male Earnings
Demographics Similar to Immigrants from Barbados by Median Male Earnings
In terms of median male earnings, the demographic groups most similar to Immigrants from Barbados are Malaysian ($50,772, a difference of 0.050%), American ($50,761, a difference of 0.070%), Pennsylvania German ($50,878, a difference of 0.16%), West Indian ($50,682, a difference of 0.22%), and Immigrants from St. Vincent and the Grenadines ($50,665, a difference of 0.26%).
| Demographics | Rating | Rank | Median Male Earnings |
| Immigrants | Nigeria | 4.2 /100 | #230 | Tragic $51,310 |
| Barbadians | 3.9 /100 | #231 | Tragic $51,236 |
| Sudanese | 3.9 /100 | #232 | Tragic $51,216 |
| Aleuts | 3.7 /100 | #233 | Tragic $51,168 |
| Cape Verdeans | 3.5 /100 | #234 | Tragic $51,103 |
| Immigrants | Western Africa | 3.0 /100 | #235 | Tragic $50,940 |
| Pennsylvania Germans | 2.8 /100 | #236 | Tragic $50,878 |
| Immigrants | Barbados | 2.6 /100 | #237 | Tragic $50,795 |
| Malaysians | 2.5 /100 | #238 | Tragic $50,772 |
| Americans | 2.5 /100 | #239 | Tragic $50,761 |
| West Indians | 2.3 /100 | #240 | Tragic $50,682 |
| Immigrants | St. Vincent and the Grenadines | 2.3 /100 | #241 | Tragic $50,665 |
| Guyanese | 2.2 /100 | #242 | Tragic $50,613 |
| French American Indians | 2.2 /100 | #243 | Tragic $50,611 |
| Houma | 2.0 /100 | #244 | Tragic $50,547 |
Demographics Similar to Yakama by Median Male Earnings
In terms of median male earnings, the demographic groups most similar to Yakama are Immigrants from Mexico ($44,960, a difference of 0.090%), Kiowa ($45,094, a difference of 0.20%), Immigrants from Bahamas ($45,176, a difference of 0.39%), Native/Alaskan ($44,775, a difference of 0.51%), and Bahamian ($44,756, a difference of 0.55%).
| Demographics | Rating | Rank | Median Male Earnings |
| Sioux | 0.0 /100 | #322 | Tragic $45,566 |
| Immigrants | Central America | 0.0 /100 | #323 | Tragic $45,538 |
| Blacks/African Americans | 0.0 /100 | #324 | Tragic $45,523 |
| Yuman | 0.0 /100 | #325 | Tragic $45,446 |
| Immigrants | Haiti | 0.0 /100 | #326 | Tragic $45,266 |
| Immigrants | Bahamas | 0.0 /100 | #327 | Tragic $45,176 |
| Kiowa | 0.0 /100 | #328 | Tragic $45,094 |
| Yakama | 0.0 /100 | #329 | Tragic $45,002 |
| Immigrants | Mexico | 0.0 /100 | #330 | Tragic $44,960 |
| Natives/Alaskans | 0.0 /100 | #331 | Tragic $44,775 |
| Bahamians | 0.0 /100 | #332 | Tragic $44,756 |
| Immigrants | Congo | 0.0 /100 | #333 | Tragic $44,204 |
| Immigrants | Yemen | 0.0 /100 | #334 | Tragic $44,083 |
| Spanish American Indians | 0.0 /100 | #335 | Tragic $44,010 |
| Immigrants | Cuba | 0.0 /100 | #336 | Tragic $43,461 |