Ghanaian vs Liberian Householder Income Ages 45 - 64 years
COMPARE
Ghanaian
Liberian
Householder Income Ages 45 - 64 years
Householder Income Ages 45 - 64 years Comparison
Ghanaians
Liberians
$97,277
HOUSEHOLDER INCOME AGES 45 - 64 YEARS
17.9/ 100
METRIC RATING
207th/ 347
METRIC RANK
$88,929
HOUSEHOLDER INCOME AGES 45 - 64 YEARS
0.3/ 100
METRIC RATING
260th/ 347
METRIC RANK
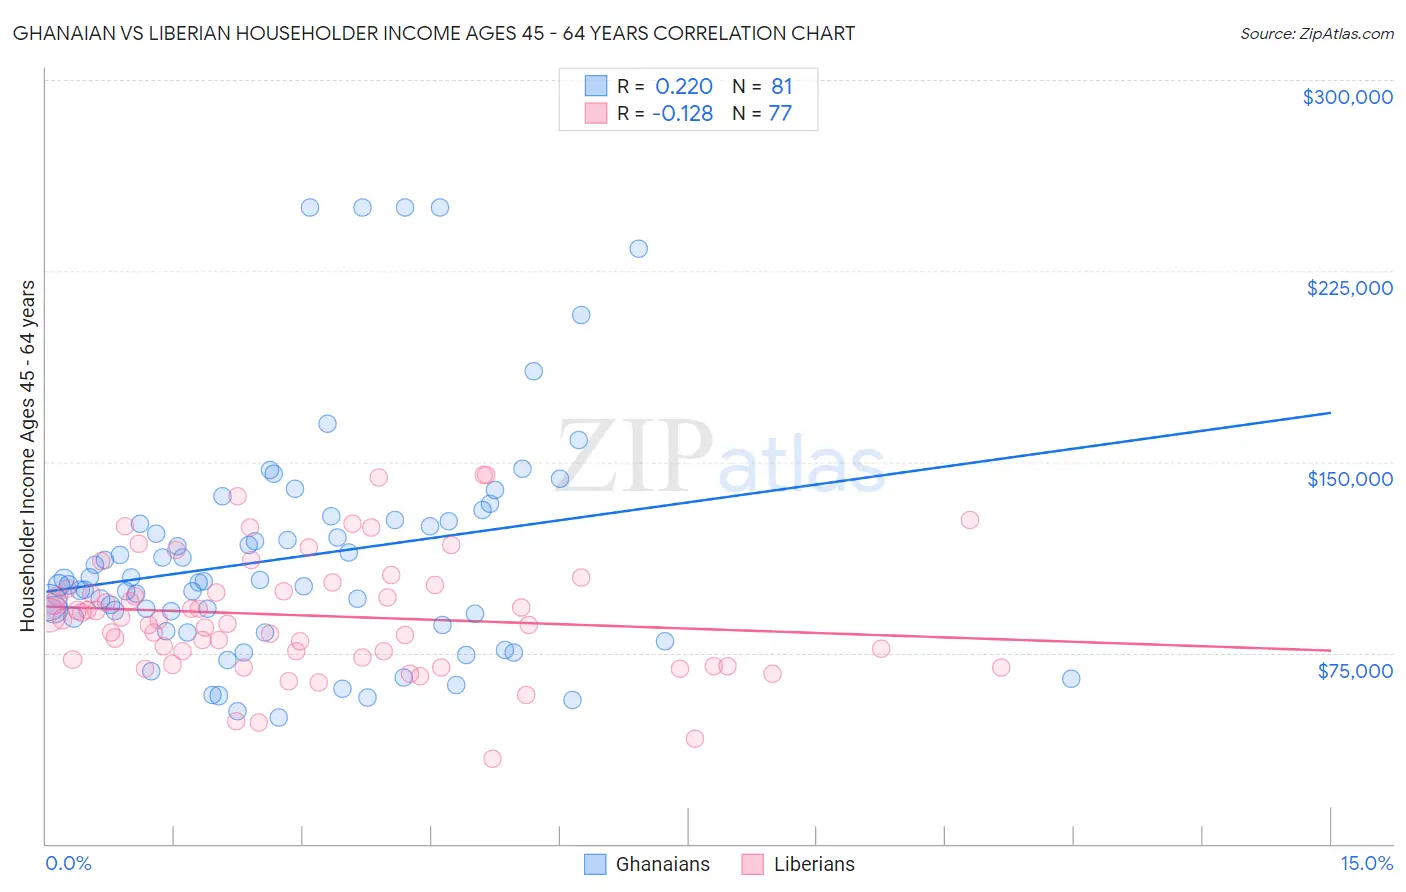
Ghanaian vs Liberian Householder Income Ages 45 - 64 years Correlation Chart
The statistical analysis conducted on geographies consisting of 190,434,757 people shows a weak positive correlation between the proportion of Ghanaians and household income with householder between the ages 45 and 64 in the United States with a correlation coefficient (R) of 0.220 and weighted average of $97,277. Similarly, the statistical analysis conducted on geographies consisting of 117,988,701 people shows a poor negative correlation between the proportion of Liberians and household income with householder between the ages 45 and 64 in the United States with a correlation coefficient (R) of -0.128 and weighted average of $88,929, a difference of 9.4%.
Householder Income Ages 45 - 64 years Correlation Summary
| Measurement | Ghanaian | Liberian |
| Minimum | $49,787 | $33,597 |
| Maximum | $250,001 | $144,731 |
| Range | $200,214 | $111,134 |
| Mean | $112,590 | $89,630 |
| Median | $102,711 | $88,174 |
| Interquartile 25% (IQ1) | $84,781 | $72,788 |
| Interquartile 75% (IQ3) | $126,915 | $100,871 |
| Interquartile Range (IQR) | $42,134 | $28,083 |
| Standard Deviation (Sample) | $45,701 | $23,274 |
| Standard Deviation (Population) | $45,418 | $23,122 |
Similar Demographics by Householder Income Ages 45 - 64 years
Demographics Similar to Ghanaians by Householder Income Ages 45 - 64 years
In terms of householder income ages 45 - 64 years, the demographic groups most similar to Ghanaians are Immigrants from Colombia ($97,290, a difference of 0.010%), Immigrants from Africa ($97,284, a difference of 0.010%), Immigrants from Eritrea ($97,373, a difference of 0.10%), Immigrants from Thailand ($97,400, a difference of 0.13%), and Tlingit-Haida ($97,417, a difference of 0.14%).
| Demographics | Rating | Rank | Householder Income Ages 45 - 64 years |
| Immigrants | Kenya | 23.5 /100 | #200 | Fair $97,964 |
| Yugoslavians | 20.0 /100 | #201 | Fair $97,558 |
| Tlingit-Haida | 18.9 /100 | #202 | Poor $97,417 |
| Immigrants | Thailand | 18.8 /100 | #203 | Poor $97,400 |
| Immigrants | Eritrea | 18.6 /100 | #204 | Poor $97,373 |
| Immigrants | Colombia | 18.0 /100 | #205 | Poor $97,290 |
| Immigrants | Africa | 17.9 /100 | #206 | Poor $97,284 |
| Ghanaians | 17.9 /100 | #207 | Poor $97,277 |
| Scotch-Irish | 16.4 /100 | #208 | Poor $97,073 |
| Japanese | 14.8 /100 | #209 | Poor $96,834 |
| Tsimshian | 14.5 /100 | #210 | Poor $96,783 |
| Immigrants | Cambodia | 13.0 /100 | #211 | Poor $96,537 |
| Venezuelans | 12.6 /100 | #212 | Poor $96,460 |
| Immigrants | Uruguay | 10.7 /100 | #213 | Poor $96,086 |
| Panamanians | 10.6 /100 | #214 | Poor $96,066 |
Demographics Similar to Liberians by Householder Income Ages 45 - 64 years
In terms of householder income ages 45 - 64 years, the demographic groups most similar to Liberians are Immigrants from Nicaragua ($89,108, a difference of 0.20%), Belizean ($88,684, a difference of 0.28%), Somali ($88,600, a difference of 0.37%), Immigrants from Barbados ($89,394, a difference of 0.52%), and German Russian ($89,398, a difference of 0.53%).
| Demographics | Rating | Rank | Householder Income Ages 45 - 64 years |
| Barbadians | 0.6 /100 | #253 | Tragic $90,266 |
| Immigrants | Guyana | 0.6 /100 | #254 | Tragic $90,186 |
| West Indians | 0.5 /100 | #255 | Tragic $89,906 |
| French American Indians | 0.5 /100 | #256 | Tragic $89,811 |
| German Russians | 0.4 /100 | #257 | Tragic $89,398 |
| Immigrants | Barbados | 0.4 /100 | #258 | Tragic $89,394 |
| Immigrants | Nicaragua | 0.4 /100 | #259 | Tragic $89,108 |
| Liberians | 0.3 /100 | #260 | Tragic $88,929 |
| Belizeans | 0.3 /100 | #261 | Tragic $88,684 |
| Somalis | 0.3 /100 | #262 | Tragic $88,600 |
| Immigrants | Senegal | 0.3 /100 | #263 | Tragic $88,421 |
| Osage | 0.3 /100 | #264 | Tragic $88,390 |
| Jamaicans | 0.2 /100 | #265 | Tragic $88,327 |
| Immigrants | West Indies | 0.2 /100 | #266 | Tragic $88,164 |
| Hmong | 0.2 /100 | #267 | Tragic $88,115 |