German Russian vs Puget Sound Salish Child Poverty Under the Age of 16
COMPARE
German Russian
Puget Sound Salish
Child Poverty Under the Age of 16
Child Poverty Under the Age of 16 Comparison
German Russians
Puget Sound Salish
17.4%
CHILD POVERTY UNDER THE AGE OF 16
8.6/ 100
METRIC RATING
207th/ 347
METRIC RANK
15.5%
CHILD POVERTY UNDER THE AGE OF 16
80.3/ 100
METRIC RATING
148th/ 347
METRIC RANK
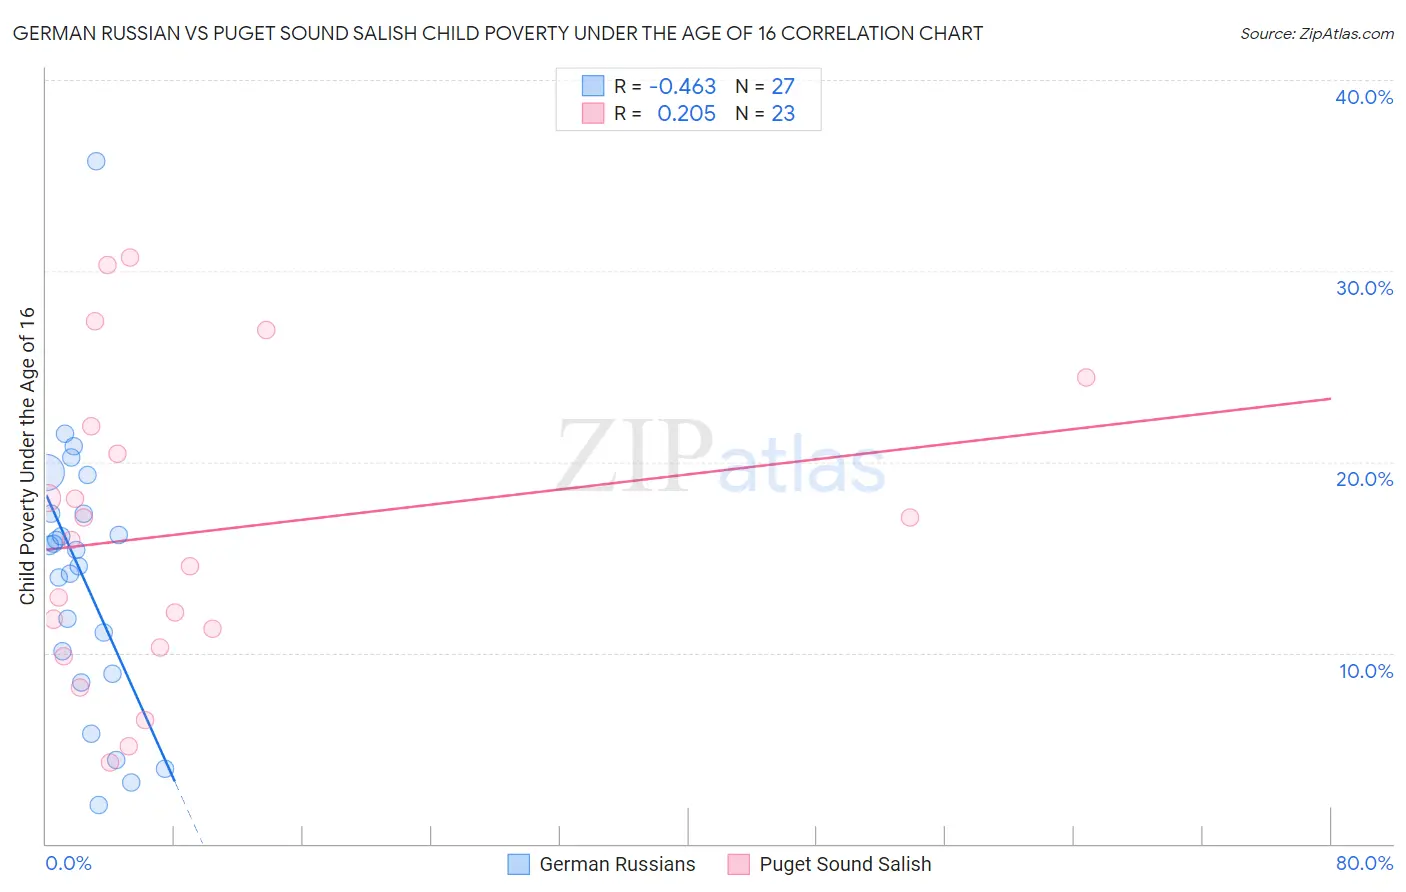
German Russian vs Puget Sound Salish Child Poverty Under the Age of 16 Correlation Chart
The statistical analysis conducted on geographies consisting of 96,218,041 people shows a moderate negative correlation between the proportion of German Russians and poverty level among children under the age of 16 in the United States with a correlation coefficient (R) of -0.463 and weighted average of 17.4%. Similarly, the statistical analysis conducted on geographies consisting of 46,038,820 people shows a weak positive correlation between the proportion of Puget Sound Salish and poverty level among children under the age of 16 in the United States with a correlation coefficient (R) of 0.205 and weighted average of 15.5%, a difference of 11.8%.
Child Poverty Under the Age of 16 Correlation Summary
| Measurement | German Russian | Puget Sound Salish |
| Minimum | 2.0% | 4.3% |
| Maximum | 35.7% | 30.7% |
| Range | 33.7% | 26.5% |
| Mean | 14.0% | 16.3% |
| Median | 15.4% | 15.9% |
| Interquartile 25% (IQ1) | 8.9% | 10.3% |
| Interquartile 75% (IQ3) | 17.3% | 21.9% |
| Interquartile Range (IQR) | 8.4% | 11.6% |
| Standard Deviation (Sample) | 7.1% | 7.8% |
| Standard Deviation (Population) | 7.0% | 7.7% |
Similar Demographics by Child Poverty Under the Age of 16
Demographics Similar to German Russians by Child Poverty Under the Age of 16
In terms of child poverty under the age of 16, the demographic groups most similar to German Russians are Pennsylvania German (17.4%, a difference of 0.40%), Panamanian (17.5%, a difference of 0.66%), Alaskan Athabascan (17.5%, a difference of 0.67%), Immigrants from Thailand (17.5%, a difference of 0.80%), and Immigrants (17.5%, a difference of 0.82%).
| Demographics | Rating | Rank | Child Poverty Under the Age of 16 |
| Immigrants | Cameroon | 14.7 /100 | #200 | Poor 17.1% |
| Immigrants | Uzbekistan | 14.7 /100 | #201 | Poor 17.1% |
| Ugandans | 14.3 /100 | #202 | Poor 17.1% |
| Immigrants | Sierra Leone | 14.2 /100 | #203 | Poor 17.1% |
| Hmong | 14.0 /100 | #204 | Poor 17.1% |
| Aleuts | 13.9 /100 | #205 | Poor 17.1% |
| Alaska Natives | 11.8 /100 | #206 | Poor 17.2% |
| German Russians | 8.6 /100 | #207 | Tragic 17.4% |
| Pennsylvania Germans | 7.5 /100 | #208 | Tragic 17.4% |
| Panamanians | 6.9 /100 | #209 | Tragic 17.5% |
| Alaskan Athabascans | 6.9 /100 | #210 | Tragic 17.5% |
| Immigrants | Thailand | 6.6 /100 | #211 | Tragic 17.5% |
| Immigrants | Immigrants | 6.5 /100 | #212 | Tragic 17.5% |
| Immigrants | Azores | 6.2 /100 | #213 | Tragic 17.5% |
| Iraqis | 5.9 /100 | #214 | Tragic 17.5% |
Demographics Similar to Puget Sound Salish by Child Poverty Under the Age of 16
In terms of child poverty under the age of 16, the demographic groups most similar to Puget Sound Salish are Immigrants from Kuwait (15.5%, a difference of 0.030%), Israeli (15.5%, a difference of 0.040%), Slovak (15.5%, a difference of 0.23%), Immigrants from Peru (15.5%, a difference of 0.27%), and Immigrants from Hungary (15.5%, a difference of 0.32%).
| Demographics | Rating | Rank | Child Poverty Under the Age of 16 |
| Slavs | 84.2 /100 | #141 | Excellent 15.4% |
| Brazilians | 82.8 /100 | #142 | Excellent 15.4% |
| Icelanders | 82.5 /100 | #143 | Excellent 15.4% |
| Immigrants | Hungary | 81.9 /100 | #144 | Excellent 15.5% |
| Immigrants | Peru | 81.7 /100 | #145 | Excellent 15.5% |
| Slovaks | 81.4 /100 | #146 | Excellent 15.5% |
| Immigrants | Kuwait | 80.5 /100 | #147 | Excellent 15.5% |
| Puget Sound Salish | 80.3 /100 | #148 | Excellent 15.5% |
| Israelis | 80.1 /100 | #149 | Excellent 15.5% |
| Immigrants | Jordan | 78.5 /100 | #150 | Good 15.6% |
| French | 78.5 /100 | #151 | Good 15.6% |
| French Canadians | 78.2 /100 | #152 | Good 15.6% |
| Venezuelans | 77.4 /100 | #153 | Good 15.6% |
| Samoans | 77.3 /100 | #154 | Good 15.6% |
| Syrians | 76.1 /100 | #155 | Good 15.6% |