German Russian vs Immigrants from Northern Europe Median Male Earnings
COMPARE
German Russian
Immigrants from Northern Europe
Median Male Earnings
Median Male Earnings Comparison
German Russians
Immigrants from Northern Europe
$49,924
MEDIAN MALE EARNINGS
1.1/ 100
METRIC RATING
253rd/ 347
METRIC RANK
$64,987
MEDIAN MALE EARNINGS
100.0/ 100
METRIC RATING
24th/ 347
METRIC RANK
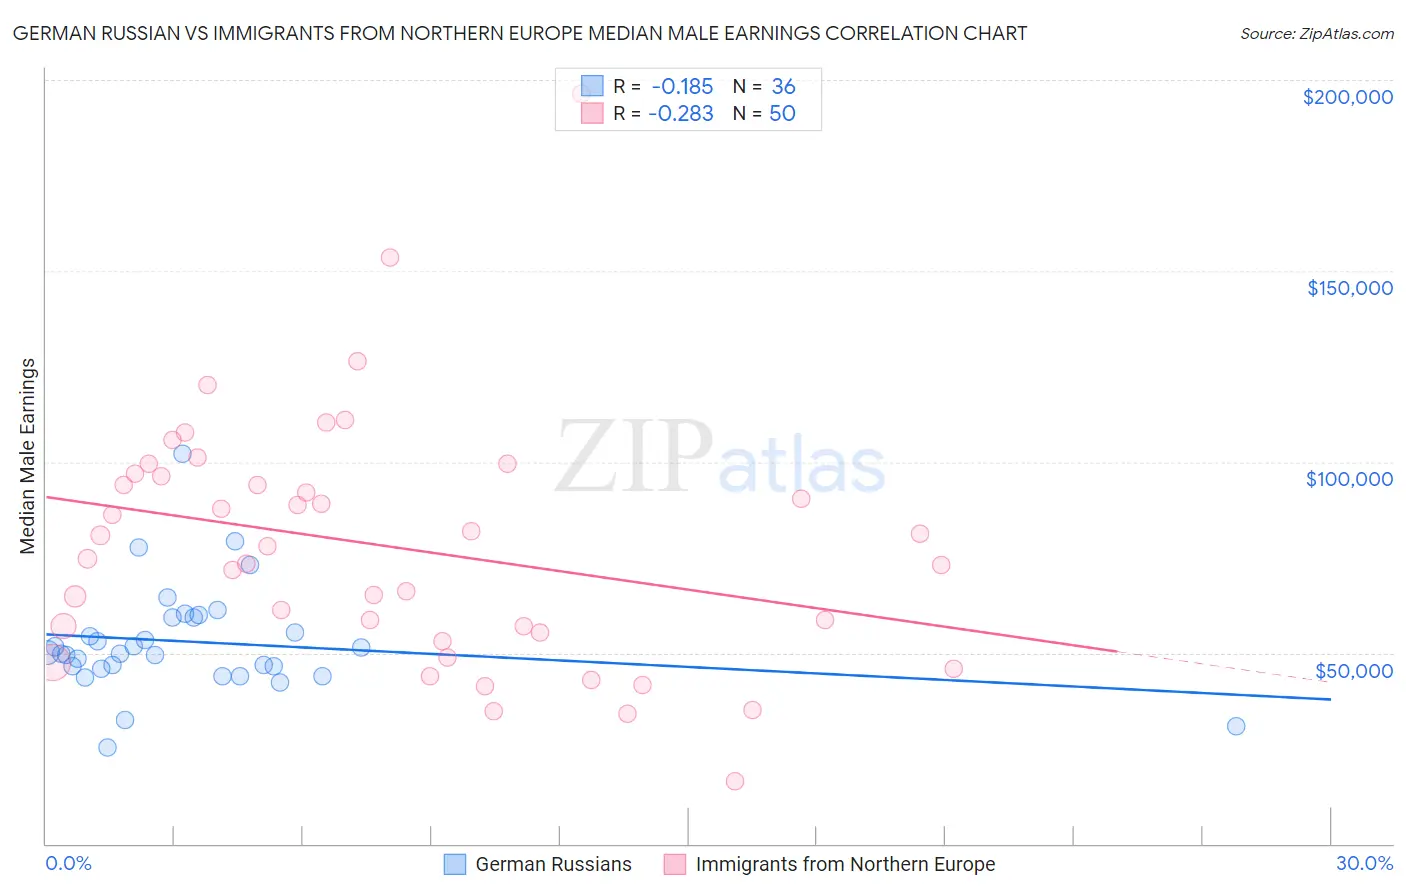
German Russian vs Immigrants from Northern Europe Median Male Earnings Correlation Chart
The statistical analysis conducted on geographies consisting of 96,455,245 people shows a poor negative correlation between the proportion of German Russians and median male earnings in the United States with a correlation coefficient (R) of -0.185 and weighted average of $49,924. Similarly, the statistical analysis conducted on geographies consisting of 476,848,141 people shows a weak negative correlation between the proportion of Immigrants from Northern Europe and median male earnings in the United States with a correlation coefficient (R) of -0.283 and weighted average of $64,987, a difference of 30.2%.
Median Male Earnings Correlation Summary
| Measurement | German Russian | Immigrants from Northern Europe |
| Minimum | $25,295 | $16,326 |
| Maximum | $101,964 | $196,250 |
| Range | $76,669 | $179,924 |
| Mean | $52,820 | $77,779 |
| Median | $49,866 | $76,341 |
| Interquartile 25% (IQ1) | $46,118 | $55,250 |
| Interquartile 75% (IQ3) | $59,385 | $96,105 |
| Interquartile Range (IQR) | $13,267 | $40,855 |
| Standard Deviation (Sample) | $14,069 | $32,560 |
| Standard Deviation (Population) | $13,873 | $32,233 |
Similar Demographics by Median Male Earnings
Demographics Similar to German Russians by Median Male Earnings
In terms of median male earnings, the demographic groups most similar to German Russians are Immigrants from Cabo Verde ($50,009, a difference of 0.17%), Senegalese ($49,774, a difference of 0.30%), Alaskan Athabascan ($49,748, a difference of 0.35%), Alaska Native ($49,711, a difference of 0.43%), and British West Indian ($49,636, a difference of 0.58%).
| Demographics | Rating | Rank | Median Male Earnings |
| Immigrants | Ecuador | 1.9 /100 | #246 | Tragic $50,474 |
| Sub-Saharan Africans | 1.8 /100 | #247 | Tragic $50,408 |
| Immigrants | Guyana | 1.6 /100 | #248 | Tragic $50,321 |
| Immigrants | Burma/Myanmar | 1.6 /100 | #249 | Tragic $50,298 |
| Osage | 1.6 /100 | #250 | Tragic $50,292 |
| Immigrants | Grenada | 1.6 /100 | #251 | Tragic $50,279 |
| Immigrants | Cabo Verde | 1.2 /100 | #252 | Tragic $50,009 |
| German Russians | 1.1 /100 | #253 | Tragic $49,924 |
| Senegalese | 1.0 /100 | #254 | Tragic $49,774 |
| Alaskan Athabascans | 0.9 /100 | #255 | Tragic $49,748 |
| Alaska Natives | 0.9 /100 | #256 | Tragic $49,711 |
| British West Indians | 0.8 /100 | #257 | Tragic $49,636 |
| Cree | 0.7 /100 | #258 | Tragic $49,497 |
| Nepalese | 0.7 /100 | #259 | Tragic $49,458 |
| Iroquois | 0.7 /100 | #260 | Tragic $49,374 |
Demographics Similar to Immigrants from Northern Europe by Median Male Earnings
In terms of median male earnings, the demographic groups most similar to Immigrants from Northern Europe are Immigrants from Korea ($65,079, a difference of 0.14%), Burmese ($65,236, a difference of 0.38%), Immigrants from Denmark ($64,625, a difference of 0.56%), Immigrants from Sweden ($65,406, a difference of 0.65%), and Immigrants from Japan ($65,518, a difference of 0.82%).
| Demographics | Rating | Rank | Median Male Earnings |
| Immigrants | Belgium | 100.0 /100 | #17 | Exceptional $66,125 |
| Indians (Asian) | 100.0 /100 | #18 | Exceptional $66,078 |
| Cypriots | 100.0 /100 | #19 | Exceptional $65,549 |
| Immigrants | Japan | 100.0 /100 | #20 | Exceptional $65,518 |
| Immigrants | Sweden | 100.0 /100 | #21 | Exceptional $65,406 |
| Burmese | 100.0 /100 | #22 | Exceptional $65,236 |
| Immigrants | Korea | 100.0 /100 | #23 | Exceptional $65,079 |
| Immigrants | Northern Europe | 100.0 /100 | #24 | Exceptional $64,987 |
| Immigrants | Denmark | 100.0 /100 | #25 | Exceptional $64,625 |
| Turks | 100.0 /100 | #26 | Exceptional $64,253 |
| Immigrants | Switzerland | 100.0 /100 | #27 | Exceptional $63,944 |
| Russians | 100.0 /100 | #28 | Exceptional $63,939 |
| Asians | 100.0 /100 | #29 | Exceptional $63,827 |
| Immigrants | France | 100.0 /100 | #30 | Exceptional $63,715 |
| Latvians | 100.0 /100 | #31 | Exceptional $63,498 |