German Russian vs Cajun Householder Income Ages 45 - 64 years
COMPARE
German Russian
Cajun
Householder Income Ages 45 - 64 years
Householder Income Ages 45 - 64 years Comparison
German Russians
Cajuns
$89,398
HOUSEHOLDER INCOME AGES 45 - 64 YEARS
0.4/ 100
METRIC RATING
257th/ 347
METRIC RANK
$83,015
HOUSEHOLDER INCOME AGES 45 - 64 YEARS
0.0/ 100
METRIC RATING
312th/ 347
METRIC RANK
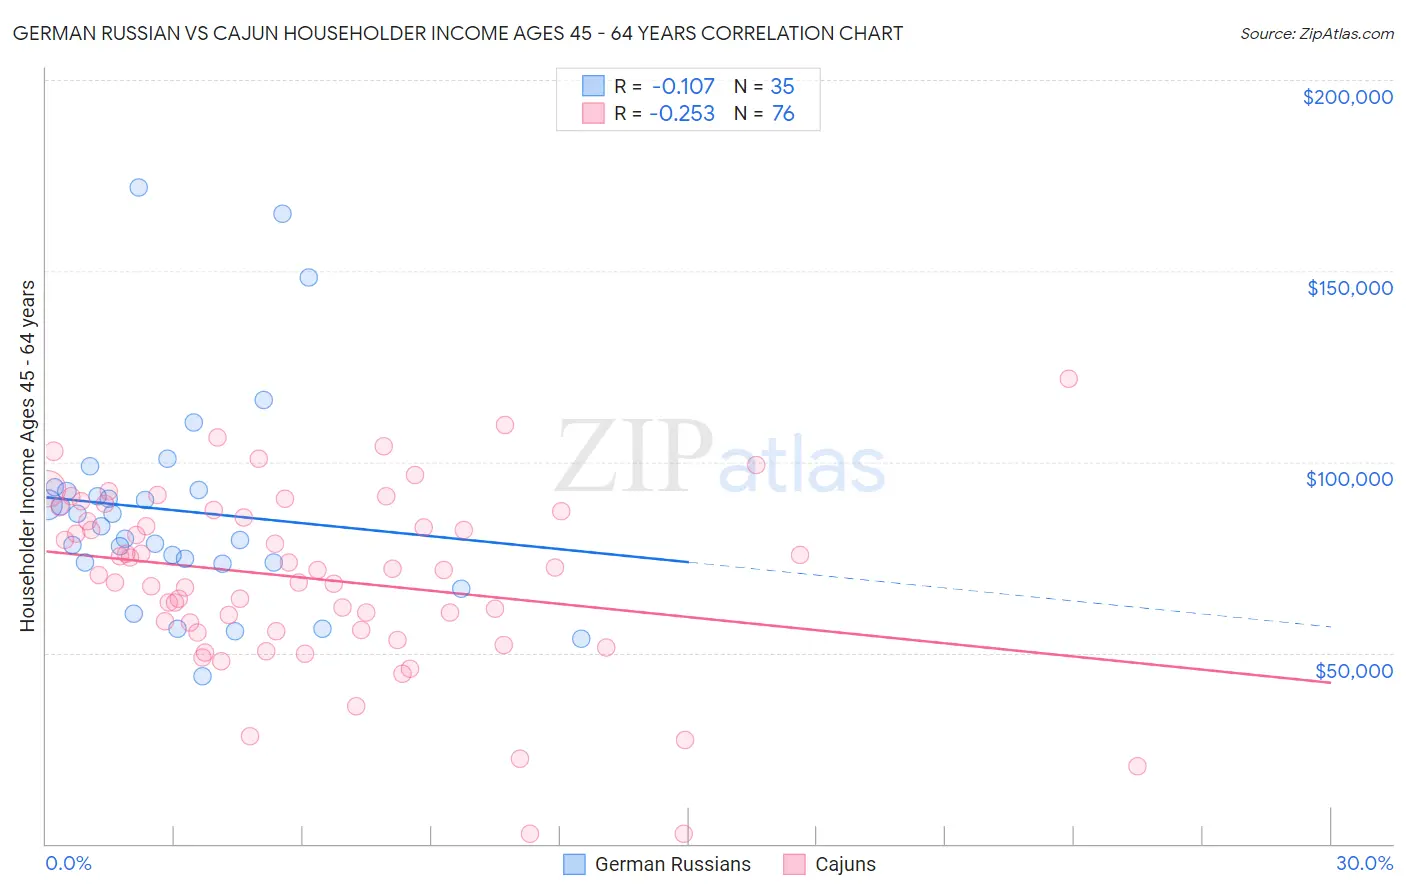
German Russian vs Cajun Householder Income Ages 45 - 64 years Correlation Chart
The statistical analysis conducted on geographies consisting of 96,410,243 people shows a poor negative correlation between the proportion of German Russians and household income with householder between the ages 45 and 64 in the United States with a correlation coefficient (R) of -0.107 and weighted average of $89,398. Similarly, the statistical analysis conducted on geographies consisting of 149,484,313 people shows a weak negative correlation between the proportion of Cajuns and household income with householder between the ages 45 and 64 in the United States with a correlation coefficient (R) of -0.253 and weighted average of $83,015, a difference of 7.7%.
Householder Income Ages 45 - 64 years Correlation Summary
| Measurement | German Russian | Cajun |
| Minimum | $43,750 | $2,499 |
| Maximum | $171,788 | $121,893 |
| Range | $128,038 | $119,394 |
| Mean | $87,182 | $69,425 |
| Median | $83,043 | $71,604 |
| Interquartile 25% (IQ1) | $73,744 | $55,904 |
| Interquartile 75% (IQ3) | $92,651 | $86,282 |
| Interquartile Range (IQR) | $18,907 | $30,378 |
| Standard Deviation (Sample) | $28,210 | $23,334 |
| Standard Deviation (Population) | $27,804 | $23,180 |
Similar Demographics by Householder Income Ages 45 - 64 years
Demographics Similar to German Russians by Householder Income Ages 45 - 64 years
In terms of householder income ages 45 - 64 years, the demographic groups most similar to German Russians are Immigrants from Barbados ($89,394, a difference of 0.0%), Immigrants from Nicaragua ($89,108, a difference of 0.33%), French American Indian ($89,811, a difference of 0.46%), Liberian ($88,929, a difference of 0.53%), and West Indian ($89,906, a difference of 0.57%).
| Demographics | Rating | Rank | Householder Income Ages 45 - 64 years |
| Sub-Saharan Africans | 0.8 /100 | #250 | Tragic $90,691 |
| Americans | 0.7 /100 | #251 | Tragic $90,536 |
| Marshallese | 0.7 /100 | #252 | Tragic $90,455 |
| Barbadians | 0.6 /100 | #253 | Tragic $90,266 |
| Immigrants | Guyana | 0.6 /100 | #254 | Tragic $90,186 |
| West Indians | 0.5 /100 | #255 | Tragic $89,906 |
| French American Indians | 0.5 /100 | #256 | Tragic $89,811 |
| German Russians | 0.4 /100 | #257 | Tragic $89,398 |
| Immigrants | Barbados | 0.4 /100 | #258 | Tragic $89,394 |
| Immigrants | Nicaragua | 0.4 /100 | #259 | Tragic $89,108 |
| Liberians | 0.3 /100 | #260 | Tragic $88,929 |
| Belizeans | 0.3 /100 | #261 | Tragic $88,684 |
| Somalis | 0.3 /100 | #262 | Tragic $88,600 |
| Immigrants | Senegal | 0.3 /100 | #263 | Tragic $88,421 |
| Osage | 0.3 /100 | #264 | Tragic $88,390 |
Demographics Similar to Cajuns by Householder Income Ages 45 - 64 years
In terms of householder income ages 45 - 64 years, the demographic groups most similar to Cajuns are Immigrants from Bahamas ($83,177, a difference of 0.20%), Immigrants from Haiti ($83,257, a difference of 0.29%), U.S. Virgin Islander ($82,736, a difference of 0.34%), Immigrants from Dominica ($83,311, a difference of 0.36%), and Immigrants from Honduras ($82,697, a difference of 0.39%).
| Demographics | Rating | Rank | Householder Income Ages 45 - 64 years |
| Chippewa | 0.0 /100 | #305 | Tragic $83,943 |
| Ute | 0.0 /100 | #306 | Tragic $83,937 |
| Shoshone | 0.0 /100 | #307 | Tragic $83,588 |
| Immigrants | Cabo Verde | 0.0 /100 | #308 | Tragic $83,542 |
| Immigrants | Dominica | 0.0 /100 | #309 | Tragic $83,311 |
| Immigrants | Haiti | 0.0 /100 | #310 | Tragic $83,257 |
| Immigrants | Bahamas | 0.0 /100 | #311 | Tragic $83,177 |
| Cajuns | 0.0 /100 | #312 | Tragic $83,015 |
| U.S. Virgin Islanders | 0.0 /100 | #313 | Tragic $82,736 |
| Immigrants | Honduras | 0.0 /100 | #314 | Tragic $82,697 |
| Paiute | 0.0 /100 | #315 | Tragic $82,629 |
| Immigrants | Caribbean | 0.0 /100 | #316 | Tragic $82,513 |
| Colville | 0.0 /100 | #317 | Tragic $82,474 |
| Choctaw | 0.0 /100 | #318 | Tragic $82,287 |
| Chickasaw | 0.0 /100 | #319 | Tragic $82,193 |