German Russian vs Slovene Householder Income Ages 45 - 64 years
COMPARE
German Russian
Slovene
Householder Income Ages 45 - 64 years
Householder Income Ages 45 - 64 years Comparison
German Russians
Slovenes
$89,398
HOUSEHOLDER INCOME AGES 45 - 64 YEARS
0.4/ 100
METRIC RATING
257th/ 347
METRIC RANK
$102,885
HOUSEHOLDER INCOME AGES 45 - 64 YEARS
78.3/ 100
METRIC RATING
154th/ 347
METRIC RANK
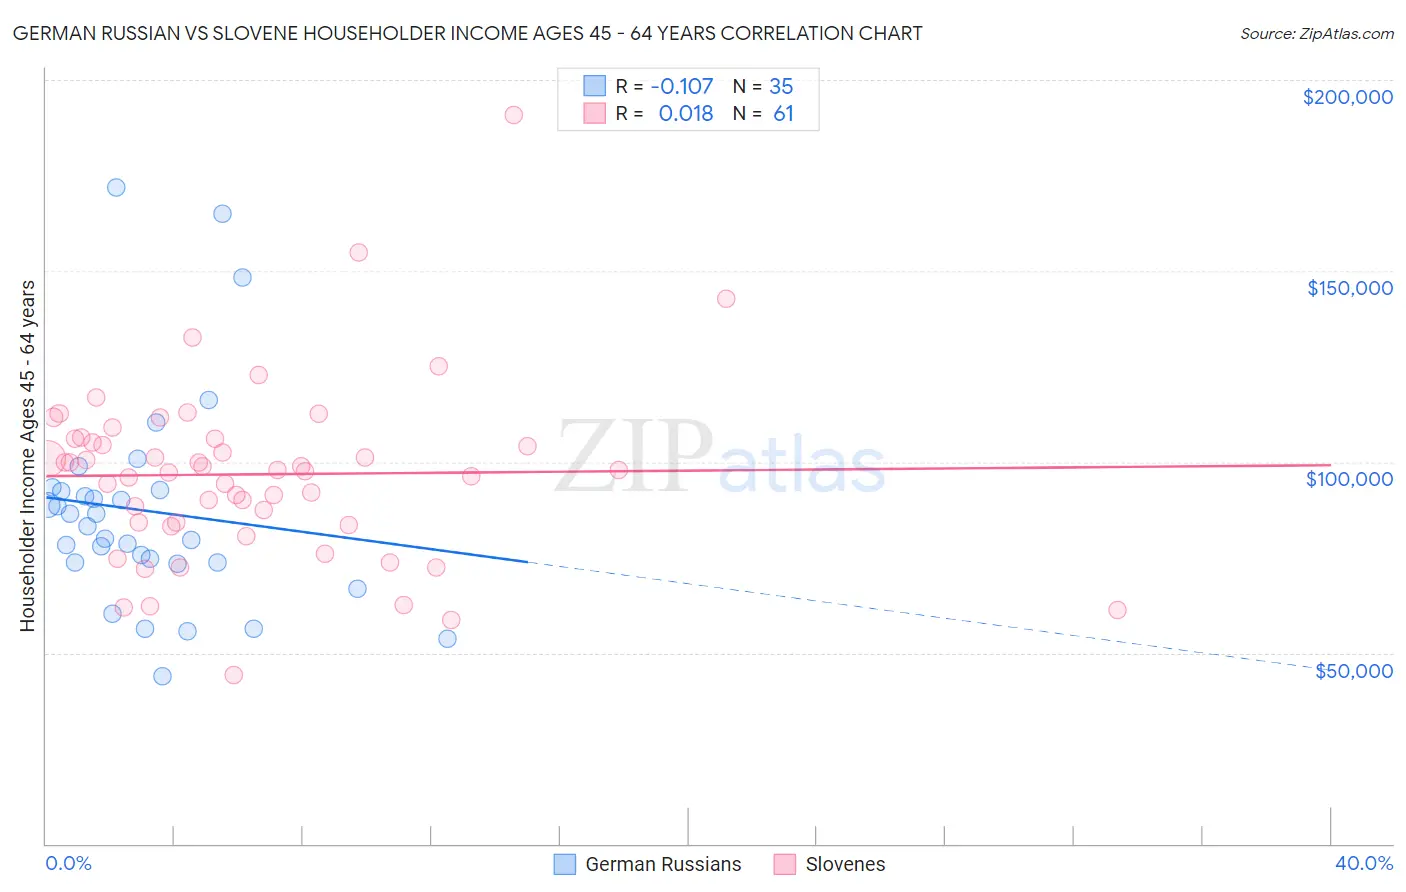
German Russian vs Slovene Householder Income Ages 45 - 64 years Correlation Chart
The statistical analysis conducted on geographies consisting of 96,410,243 people shows a poor negative correlation between the proportion of German Russians and household income with householder between the ages 45 and 64 in the United States with a correlation coefficient (R) of -0.107 and weighted average of $89,398. Similarly, the statistical analysis conducted on geographies consisting of 261,090,086 people shows no correlation between the proportion of Slovenes and household income with householder between the ages 45 and 64 in the United States with a correlation coefficient (R) of 0.018 and weighted average of $102,885, a difference of 15.1%.
Householder Income Ages 45 - 64 years Correlation Summary
| Measurement | German Russian | Slovene |
| Minimum | $43,750 | $44,107 |
| Maximum | $171,788 | $190,938 |
| Range | $128,038 | $146,831 |
| Mean | $87,182 | $96,740 |
| Median | $83,043 | $97,917 |
| Interquartile 25% (IQ1) | $73,744 | $83,761 |
| Interquartile 75% (IQ3) | $92,651 | $106,022 |
| Interquartile Range (IQR) | $18,907 | $22,261 |
| Standard Deviation (Sample) | $28,210 | $23,476 |
| Standard Deviation (Population) | $27,804 | $23,282 |
Similar Demographics by Householder Income Ages 45 - 64 years
Demographics Similar to German Russians by Householder Income Ages 45 - 64 years
In terms of householder income ages 45 - 64 years, the demographic groups most similar to German Russians are Immigrants from Barbados ($89,394, a difference of 0.0%), Immigrants from Nicaragua ($89,108, a difference of 0.33%), French American Indian ($89,811, a difference of 0.46%), Liberian ($88,929, a difference of 0.53%), and West Indian ($89,906, a difference of 0.57%).
| Demographics | Rating | Rank | Householder Income Ages 45 - 64 years |
| Sub-Saharan Africans | 0.8 /100 | #250 | Tragic $90,691 |
| Americans | 0.7 /100 | #251 | Tragic $90,536 |
| Marshallese | 0.7 /100 | #252 | Tragic $90,455 |
| Barbadians | 0.6 /100 | #253 | Tragic $90,266 |
| Immigrants | Guyana | 0.6 /100 | #254 | Tragic $90,186 |
| West Indians | 0.5 /100 | #255 | Tragic $89,906 |
| French American Indians | 0.5 /100 | #256 | Tragic $89,811 |
| German Russians | 0.4 /100 | #257 | Tragic $89,398 |
| Immigrants | Barbados | 0.4 /100 | #258 | Tragic $89,394 |
| Immigrants | Nicaragua | 0.4 /100 | #259 | Tragic $89,108 |
| Liberians | 0.3 /100 | #260 | Tragic $88,929 |
| Belizeans | 0.3 /100 | #261 | Tragic $88,684 |
| Somalis | 0.3 /100 | #262 | Tragic $88,600 |
| Immigrants | Senegal | 0.3 /100 | #263 | Tragic $88,421 |
| Osage | 0.3 /100 | #264 | Tragic $88,390 |
Demographics Similar to Slovenes by Householder Income Ages 45 - 64 years
In terms of householder income ages 45 - 64 years, the demographic groups most similar to Slovenes are Scandinavian ($102,969, a difference of 0.080%), Costa Rican ($102,779, a difference of 0.10%), Carpatho Rusyn ($102,777, a difference of 0.11%), Immigrants from Ethiopia ($102,763, a difference of 0.12%), and Swiss ($103,071, a difference of 0.18%).
| Demographics | Rating | Rank | Householder Income Ages 45 - 64 years |
| Basques | 82.3 /100 | #147 | Excellent $103,387 |
| Immigrants | Germany | 81.5 /100 | #148 | Excellent $103,282 |
| Immigrants | Sierra Leone | 81.1 /100 | #149 | Excellent $103,227 |
| Immigrants | Peru | 80.7 /100 | #150 | Excellent $103,173 |
| Swiss | 79.9 /100 | #151 | Good $103,071 |
| Irish | 79.8 /100 | #152 | Good $103,067 |
| Scandinavians | 79.0 /100 | #153 | Good $102,969 |
| Slovenes | 78.3 /100 | #154 | Good $102,885 |
| Costa Ricans | 77.4 /100 | #155 | Good $102,779 |
| Carpatho Rusyns | 77.4 /100 | #156 | Good $102,777 |
| Immigrants | Ethiopia | 77.3 /100 | #157 | Good $102,763 |
| Slavs | 76.1 /100 | #158 | Good $102,629 |
| Sierra Leoneans | 74.2 /100 | #159 | Good $102,427 |
| Icelanders | 72.5 /100 | #160 | Good $102,261 |
| Immigrants | Nepal | 71.8 /100 | #161 | Good $102,190 |