Tsimshian vs Shoshone Householder Income Ages 45 - 64 years
COMPARE
Tsimshian
Shoshone
Householder Income Ages 45 - 64 years
Householder Income Ages 45 - 64 years Comparison
Tsimshian
Shoshone
$96,783
HOUSEHOLDER INCOME AGES 45 - 64 YEARS
14.5/ 100
METRIC RATING
210th/ 347
METRIC RANK
$83,588
HOUSEHOLDER INCOME AGES 45 - 64 YEARS
0.0/ 100
METRIC RATING
307th/ 347
METRIC RANK
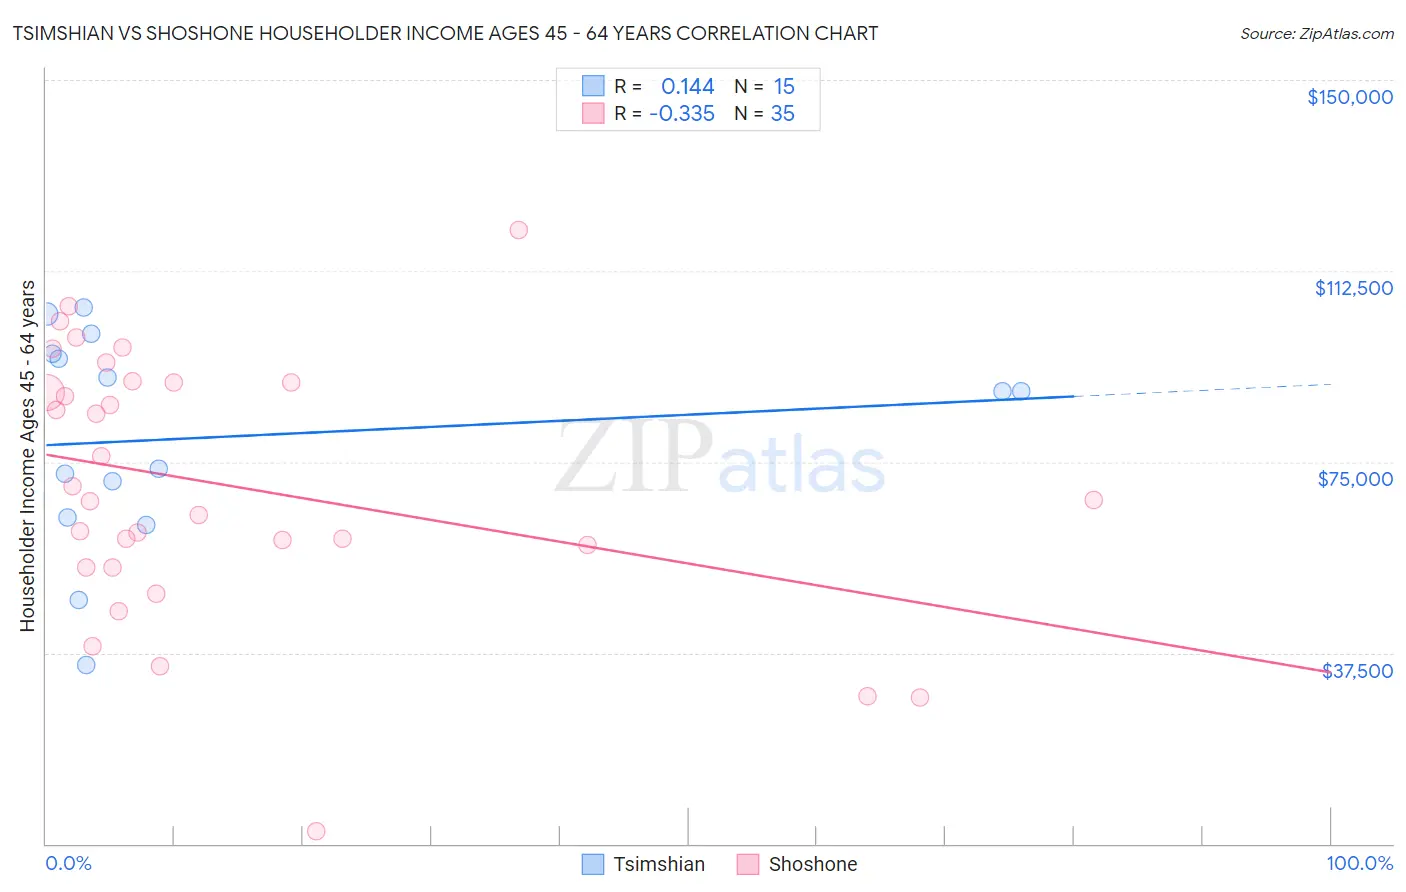
Tsimshian vs Shoshone Householder Income Ages 45 - 64 years Correlation Chart
The statistical analysis conducted on geographies consisting of 15,616,673 people shows a poor positive correlation between the proportion of Tsimshian and household income with householder between the ages 45 and 64 in the United States with a correlation coefficient (R) of 0.144 and weighted average of $96,783. Similarly, the statistical analysis conducted on geographies consisting of 66,599,308 people shows a mild negative correlation between the proportion of Shoshone and household income with householder between the ages 45 and 64 in the United States with a correlation coefficient (R) of -0.335 and weighted average of $83,588, a difference of 15.8%.
Householder Income Ages 45 - 64 years Correlation Summary
| Measurement | Tsimshian | Shoshone |
| Minimum | $35,000 | $2,499 |
| Maximum | $105,417 | $120,500 |
| Range | $70,417 | $118,001 |
| Mean | $79,823 | $70,433 |
| Median | $88,750 | $67,500 |
| Interquartile 25% (IQ1) | $64,063 | $54,344 |
| Interquartile 75% (IQ3) | $96,327 | $90,536 |
| Interquartile Range (IQR) | $32,264 | $36,192 |
| Standard Deviation (Sample) | $21,070 | $25,918 |
| Standard Deviation (Population) | $20,355 | $25,545 |
Similar Demographics by Householder Income Ages 45 - 64 years
Demographics Similar to Tsimshian by Householder Income Ages 45 - 64 years
In terms of householder income ages 45 - 64 years, the demographic groups most similar to Tsimshian are Japanese ($96,834, a difference of 0.050%), Immigrants from Cambodia ($96,537, a difference of 0.26%), Scotch-Irish ($97,073, a difference of 0.30%), Venezuelan ($96,460, a difference of 0.34%), and Ghanaian ($97,277, a difference of 0.51%).
| Demographics | Rating | Rank | Householder Income Ages 45 - 64 years |
| Immigrants | Thailand | 18.8 /100 | #203 | Poor $97,400 |
| Immigrants | Eritrea | 18.6 /100 | #204 | Poor $97,373 |
| Immigrants | Colombia | 18.0 /100 | #205 | Poor $97,290 |
| Immigrants | Africa | 17.9 /100 | #206 | Poor $97,284 |
| Ghanaians | 17.9 /100 | #207 | Poor $97,277 |
| Scotch-Irish | 16.4 /100 | #208 | Poor $97,073 |
| Japanese | 14.8 /100 | #209 | Poor $96,834 |
| Tsimshian | 14.5 /100 | #210 | Poor $96,783 |
| Immigrants | Cambodia | 13.0 /100 | #211 | Poor $96,537 |
| Venezuelans | 12.6 /100 | #212 | Poor $96,460 |
| Immigrants | Uruguay | 10.7 /100 | #213 | Poor $96,086 |
| Panamanians | 10.6 /100 | #214 | Poor $96,066 |
| Nigerians | 8.2 /100 | #215 | Tragic $95,492 |
| Immigrants | Venezuela | 7.6 /100 | #216 | Tragic $95,342 |
| Immigrants | Ghana | 6.4 /100 | #217 | Tragic $94,982 |
Demographics Similar to Shoshone by Householder Income Ages 45 - 64 years
In terms of householder income ages 45 - 64 years, the demographic groups most similar to Shoshone are Immigrants from Cabo Verde ($83,542, a difference of 0.060%), Immigrants from Dominica ($83,311, a difference of 0.33%), Immigrants from Haiti ($83,257, a difference of 0.40%), Ute ($83,937, a difference of 0.42%), and Chippewa ($83,943, a difference of 0.43%).
| Demographics | Rating | Rank | Householder Income Ages 45 - 64 years |
| Indonesians | 0.0 /100 | #300 | Tragic $84,890 |
| Potawatomi | 0.0 /100 | #301 | Tragic $84,613 |
| Haitians | 0.0 /100 | #302 | Tragic $84,384 |
| Hondurans | 0.0 /100 | #303 | Tragic $84,079 |
| Ottawa | 0.0 /100 | #304 | Tragic $83,953 |
| Chippewa | 0.0 /100 | #305 | Tragic $83,943 |
| Ute | 0.0 /100 | #306 | Tragic $83,937 |
| Shoshone | 0.0 /100 | #307 | Tragic $83,588 |
| Immigrants | Cabo Verde | 0.0 /100 | #308 | Tragic $83,542 |
| Immigrants | Dominica | 0.0 /100 | #309 | Tragic $83,311 |
| Immigrants | Haiti | 0.0 /100 | #310 | Tragic $83,257 |
| Immigrants | Bahamas | 0.0 /100 | #311 | Tragic $83,177 |
| Cajuns | 0.0 /100 | #312 | Tragic $83,015 |
| U.S. Virgin Islanders | 0.0 /100 | #313 | Tragic $82,736 |
| Immigrants | Honduras | 0.0 /100 | #314 | Tragic $82,697 |