Swedish vs Salvadoran Householder Income Over 65 years
COMPARE
Swedish
Salvadoran
Householder Income Over 65 years
Householder Income Over 65 years Comparison
Swedes
Salvadorans
$62,736
HOUSEHOLDER INCOME OVER 65 YEARS
86.4/ 100
METRIC RATING
127th/ 347
METRIC RANK
$59,141
HOUSEHOLDER INCOME OVER 65 YEARS
12.9/ 100
METRIC RATING
207th/ 347
METRIC RANK
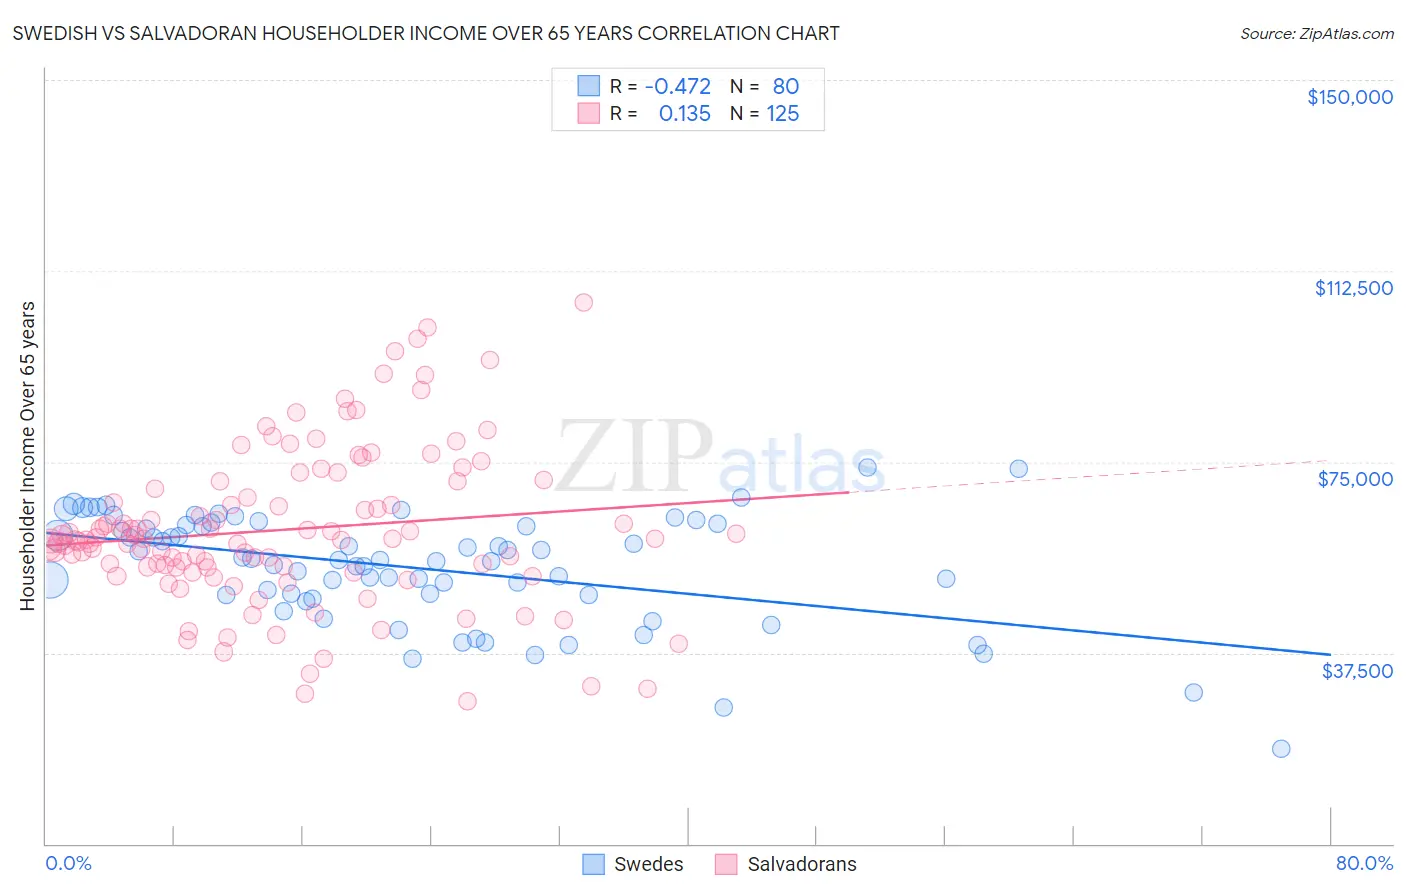
Swedish vs Salvadoran Householder Income Over 65 years Correlation Chart
The statistical analysis conducted on geographies consisting of 535,443,015 people shows a moderate negative correlation between the proportion of Swedes and household income with householder over the age of 65 in the United States with a correlation coefficient (R) of -0.472 and weighted average of $62,736. Similarly, the statistical analysis conducted on geographies consisting of 397,216,988 people shows a poor positive correlation between the proportion of Salvadorans and household income with householder over the age of 65 in the United States with a correlation coefficient (R) of 0.135 and weighted average of $59,141, a difference of 6.1%.
Householder Income Over 65 years Correlation Summary
| Measurement | Swedish | Salvadoran |
| Minimum | $18,625 | $28,014 |
| Maximum | $73,958 | $106,250 |
| Range | $55,333 | $78,236 |
| Mean | $54,196 | $61,666 |
| Median | $55,741 | $59,663 |
| Interquartile 25% (IQ1) | $48,778 | $54,245 |
| Interquartile 75% (IQ3) | $62,473 | $70,529 |
| Interquartile Range (IQR) | $13,695 | $16,284 |
| Standard Deviation (Sample) | $10,707 | $15,321 |
| Standard Deviation (Population) | $10,640 | $15,259 |
Similar Demographics by Householder Income Over 65 years
Demographics Similar to Swedes by Householder Income Over 65 years
In terms of householder income over 65 years, the demographic groups most similar to Swedes are Aleut ($62,708, a difference of 0.040%), Peruvian ($62,766, a difference of 0.050%), Immigrants from Eastern Europe ($62,693, a difference of 0.070%), Basque ($62,653, a difference of 0.13%), and Immigrants from Western Asia ($62,645, a difference of 0.15%).
| Demographics | Rating | Rank | Householder Income Over 65 years |
| Ukrainians | 89.7 /100 | #120 | Excellent $63,032 |
| Immigrants | Vietnam | 89.5 /100 | #121 | Excellent $63,014 |
| Immigrants | Moldova | 88.7 /100 | #122 | Excellent $62,939 |
| Tlingit-Haida | 88.6 /100 | #123 | Excellent $62,922 |
| Taiwanese | 88.3 /100 | #124 | Excellent $62,894 |
| Soviet Union | 87.8 /100 | #125 | Excellent $62,848 |
| Peruvians | 86.8 /100 | #126 | Excellent $62,766 |
| Swedes | 86.4 /100 | #127 | Excellent $62,736 |
| Aleuts | 86.1 /100 | #128 | Excellent $62,708 |
| Immigrants | Eastern Europe | 85.9 /100 | #129 | Excellent $62,693 |
| Basques | 85.4 /100 | #130 | Excellent $62,653 |
| Immigrants | Western Asia | 85.3 /100 | #131 | Excellent $62,645 |
| Immigrants | Germany | 83.9 /100 | #132 | Excellent $62,544 |
| Immigrants | Northern Africa | 83.6 /100 | #133 | Excellent $62,522 |
| Immigrants | Brazil | 81.2 /100 | #134 | Excellent $62,364 |
Demographics Similar to Salvadorans by Householder Income Over 65 years
In terms of householder income over 65 years, the demographic groups most similar to Salvadorans are Immigrants from South America ($59,151, a difference of 0.020%), Uruguayan ($59,090, a difference of 0.090%), Slovak ($59,039, a difference of 0.17%), Immigrants from Sudan ($59,248, a difference of 0.18%), and Nigerian ($58,992, a difference of 0.25%).
| Demographics | Rating | Rank | Householder Income Over 65 years |
| French | 20.2 /100 | #200 | Fair $59,656 |
| Dutch | 18.3 /100 | #201 | Poor $59,539 |
| Finns | 18.2 /100 | #202 | Poor $59,535 |
| Scotch-Irish | 16.9 /100 | #203 | Poor $59,447 |
| Arapaho | 16.0 /100 | #204 | Poor $59,383 |
| Immigrants | Sudan | 14.2 /100 | #205 | Poor $59,248 |
| Immigrants | South America | 13.0 /100 | #206 | Poor $59,151 |
| Salvadorans | 12.9 /100 | #207 | Poor $59,141 |
| Uruguayans | 12.3 /100 | #208 | Poor $59,090 |
| Slovaks | 11.7 /100 | #209 | Poor $59,039 |
| Nigerians | 11.2 /100 | #210 | Poor $58,992 |
| Immigrants | Nigeria | 10.7 /100 | #211 | Poor $58,942 |
| Colombians | 9.8 /100 | #212 | Tragic $58,851 |
| Whites/Caucasians | 9.8 /100 | #213 | Tragic $58,847 |
| Nepalese | 9.0 /100 | #214 | Tragic $58,761 |