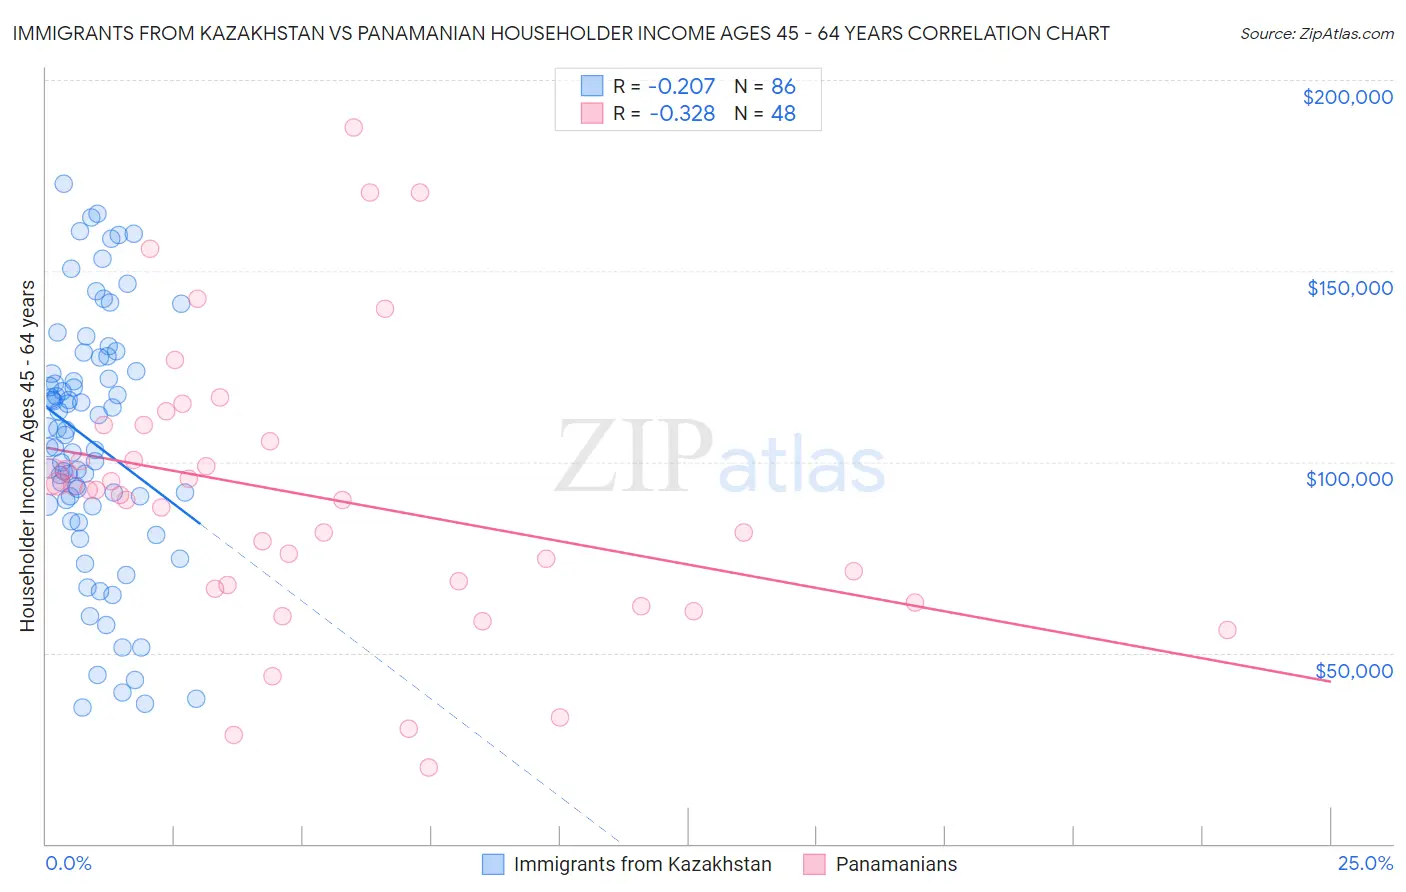
Immigrants from Kazakhstan vs Panamanian Householder Income Ages 45 - 64 years
COMPARE
Immigrants from Kazakhstan
Panamanian
Householder Income Ages 45 - 64 years
Householder Income Ages 45 - 64 years Comparison
Immigrants from Kazakhstan
Panamanians
$107,378
HOUSEHOLDER INCOME AGES 45 - 64 YEARS
97.2/ 100
METRIC RATING
101st/ 347
METRIC RANK
$96,066
HOUSEHOLDER INCOME AGES 45 - 64 YEARS
10.6/ 100
METRIC RATING
214th/ 347
METRIC RANK
Immigrants from Kazakhstan vs Panamanian Householder Income Ages 45 - 64 years Correlation Chart
The statistical analysis conducted on geographies consisting of 124,401,740 people shows a weak negative correlation between the proportion of Immigrants from Kazakhstan and household income with householder between the ages 45 and 64 in the United States with a correlation coefficient (R) of -0.207 and weighted average of $107,378. Similarly, the statistical analysis conducted on geographies consisting of 280,831,012 people shows a mild negative correlation between the proportion of Panamanians and household income with householder between the ages 45 and 64 in the United States with a correlation coefficient (R) of -0.328 and weighted average of $96,066, a difference of 11.8%.
Householder Income Ages 45 - 64 years Correlation Summary
| Measurement | Immigrants from Kazakhstan | Panamanian |
| Minimum | $35,744 | $19,813 |
| Maximum | $172,765 | $187,621 |
| Range | $137,021 | $167,808 |
| Mean | $105,299 | $90,923 |
| Median | $107,663 | $91,973 |
| Interquartile 25% (IQ1) | $88,679 | $67,292 |
| Interquartile 75% (IQ3) | $123,884 | $107,469 |
| Interquartile Range (IQR) | $35,205 | $40,176 |
| Standard Deviation (Sample) | $32,729 | $36,458 |
| Standard Deviation (Population) | $32,539 | $36,077 |
Similar Demographics by Householder Income Ages 45 - 64 years
Demographics Similar to Immigrants from Kazakhstan by Householder Income Ages 45 - 64 years
In terms of householder income ages 45 - 64 years, the demographic groups most similar to Immigrants from Kazakhstan are Immigrants from Moldova ($107,357, a difference of 0.020%), Syrian ($107,207, a difference of 0.16%), Immigrants from Serbia ($107,569, a difference of 0.18%), Immigrants from Ukraine ($107,079, a difference of 0.28%), and Macedonian ($107,074, a difference of 0.28%).
| Demographics | Rating | Rank | Householder Income Ages 45 - 64 years |
| Sri Lankans | 98.2 /100 | #94 | Exceptional $108,270 |
| Immigrants | Hungary | 98.2 /100 | #95 | Exceptional $108,267 |
| Immigrants | Argentina | 98.2 /100 | #96 | Exceptional $108,264 |
| Northern Europeans | 97.8 /100 | #97 | Exceptional $107,870 |
| Immigrants | Southern Europe | 97.7 /100 | #98 | Exceptional $107,775 |
| Palestinians | 97.6 /100 | #99 | Exceptional $107,721 |
| Immigrants | Serbia | 97.4 /100 | #100 | Exceptional $107,569 |
| Immigrants | Kazakhstan | 97.2 /100 | #101 | Exceptional $107,378 |
| Immigrants | Moldova | 97.1 /100 | #102 | Exceptional $107,357 |
| Syrians | 96.9 /100 | #103 | Exceptional $107,207 |
| Immigrants | Ukraine | 96.7 /100 | #104 | Exceptional $107,079 |
| Macedonians | 96.7 /100 | #105 | Exceptional $107,074 |
| Armenians | 96.6 /100 | #106 | Exceptional $107,002 |
| Immigrants | Fiji | 96.5 /100 | #107 | Exceptional $106,952 |
| Zimbabweans | 96.3 /100 | #108 | Exceptional $106,849 |
Demographics Similar to Panamanians by Householder Income Ages 45 - 64 years
In terms of householder income ages 45 - 64 years, the demographic groups most similar to Panamanians are Immigrants from Uruguay ($96,086, a difference of 0.020%), Venezuelan ($96,460, a difference of 0.41%), Immigrants from Cambodia ($96,537, a difference of 0.49%), Nigerian ($95,492, a difference of 0.60%), and Tsimshian ($96,783, a difference of 0.75%).
| Demographics | Rating | Rank | Householder Income Ages 45 - 64 years |
| Ghanaians | 17.9 /100 | #207 | Poor $97,277 |
| Scotch-Irish | 16.4 /100 | #208 | Poor $97,073 |
| Japanese | 14.8 /100 | #209 | Poor $96,834 |
| Tsimshian | 14.5 /100 | #210 | Poor $96,783 |
| Immigrants | Cambodia | 13.0 /100 | #211 | Poor $96,537 |
| Venezuelans | 12.6 /100 | #212 | Poor $96,460 |
| Immigrants | Uruguay | 10.7 /100 | #213 | Poor $96,086 |
| Panamanians | 10.6 /100 | #214 | Poor $96,066 |
| Nigerians | 8.2 /100 | #215 | Tragic $95,492 |
| Immigrants | Venezuela | 7.6 /100 | #216 | Tragic $95,342 |
| Immigrants | Ghana | 6.4 /100 | #217 | Tragic $94,982 |
| Delaware | 6.2 /100 | #218 | Tragic $94,914 |
| Immigrants | Armenia | 6.1 /100 | #219 | Tragic $94,863 |
| Salvadorans | 6.0 /100 | #220 | Tragic $94,842 |
| Immigrants | Nigeria | 5.9 /100 | #221 | Tragic $94,804 |