Immigrants from Northern Africa vs Immigrants from Dominica Median Female Earnings
COMPARE
Immigrants from Northern Africa
Immigrants from Dominica
Median Female Earnings
Median Female Earnings Comparison
Immigrants from Northern Africa
Immigrants from Dominica
$42,084
MEDIAN FEMALE EARNINGS
99.3/ 100
METRIC RATING
88th/ 347
METRIC RANK
$37,825
MEDIAN FEMALE EARNINGS
2.0/ 100
METRIC RATING
252nd/ 347
METRIC RANK
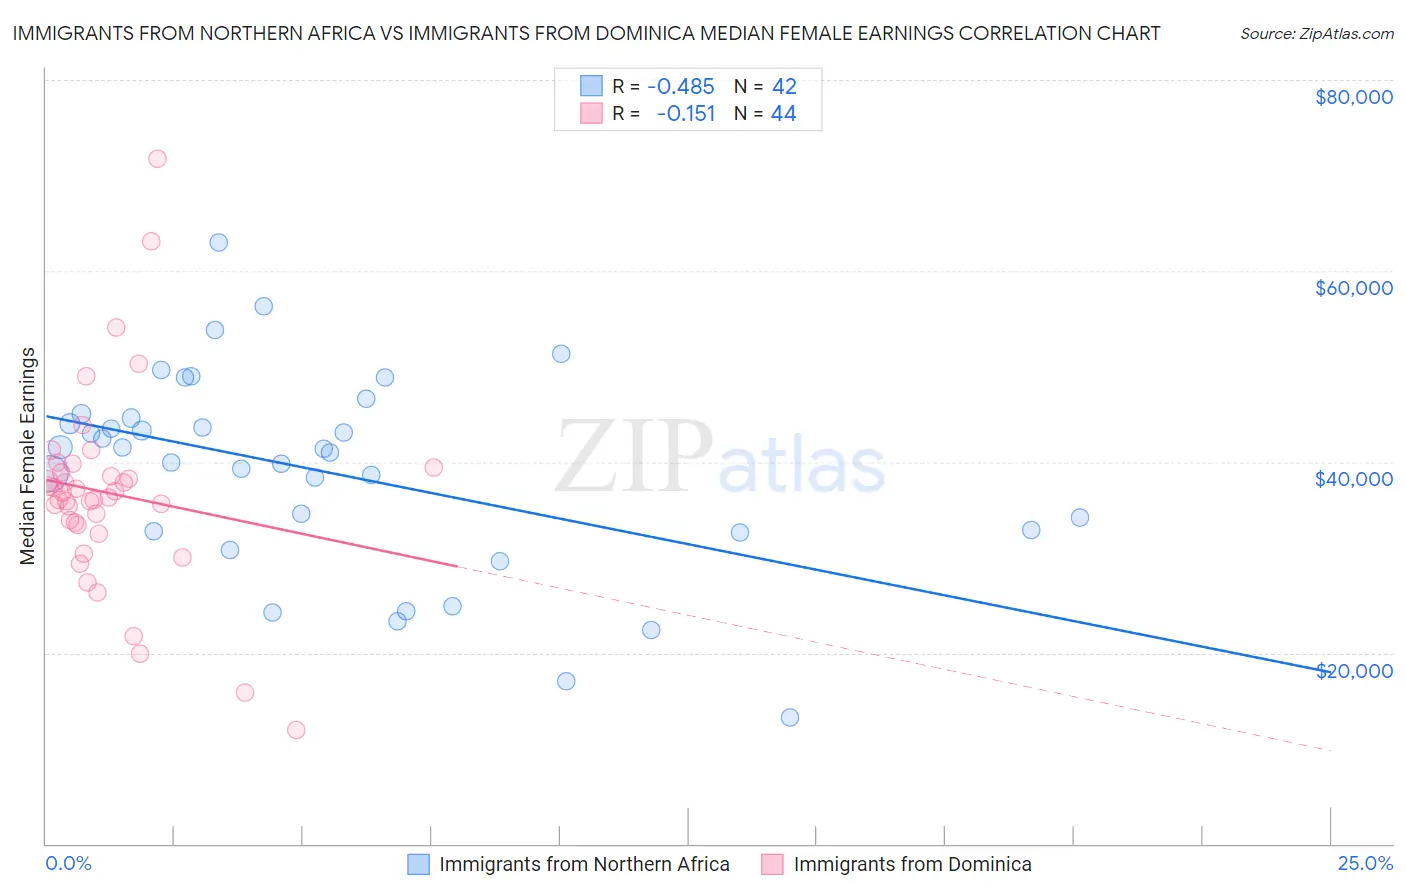
Immigrants from Northern Africa vs Immigrants from Dominica Median Female Earnings Correlation Chart
The statistical analysis conducted on geographies consisting of 321,137,511 people shows a moderate negative correlation between the proportion of Immigrants from Northern Africa and median female earnings in the United States with a correlation coefficient (R) of -0.485 and weighted average of $42,084. Similarly, the statistical analysis conducted on geographies consisting of 83,795,110 people shows a poor negative correlation between the proportion of Immigrants from Dominica and median female earnings in the United States with a correlation coefficient (R) of -0.151 and weighted average of $37,825, a difference of 11.3%.
Median Female Earnings Correlation Summary
| Measurement | Immigrants from Northern Africa | Immigrants from Dominica |
| Minimum | $13,173 | $11,953 |
| Maximum | $63,042 | $71,750 |
| Range | $49,869 | $59,797 |
| Mean | $38,964 | $36,730 |
| Median | $41,186 | $36,530 |
| Interquartile 25% (IQ1) | $32,684 | $33,522 |
| Interquartile 75% (IQ3) | $44,587 | $39,104 |
| Interquartile Range (IQR) | $11,903 | $5,583 |
| Standard Deviation (Sample) | $10,539 | $10,397 |
| Standard Deviation (Population) | $10,413 | $10,278 |
Similar Demographics by Median Female Earnings
Demographics Similar to Immigrants from Northern Africa by Median Female Earnings
In terms of median female earnings, the demographic groups most similar to Immigrants from Northern Africa are Immigrants from St. Vincent and the Grenadines ($42,108, a difference of 0.060%), Lithuanian ($42,108, a difference of 0.060%), Immigrants from Afghanistan ($42,055, a difference of 0.070%), Laotian ($42,133, a difference of 0.12%), and Ukrainian ($42,015, a difference of 0.16%).
| Demographics | Rating | Rank | Median Female Earnings |
| Immigrants | Southern Europe | 99.5 /100 | #81 | Exceptional $42,275 |
| Immigrants | Morocco | 99.5 /100 | #82 | Exceptional $42,229 |
| Immigrants | Sierra Leone | 99.5 /100 | #83 | Exceptional $42,214 |
| Armenians | 99.5 /100 | #84 | Exceptional $42,212 |
| Laotians | 99.4 /100 | #85 | Exceptional $42,133 |
| Immigrants | St. Vincent and the Grenadines | 99.3 /100 | #86 | Exceptional $42,108 |
| Lithuanians | 99.3 /100 | #87 | Exceptional $42,108 |
| Immigrants | Northern Africa | 99.3 /100 | #88 | Exceptional $42,084 |
| Immigrants | Afghanistan | 99.3 /100 | #89 | Exceptional $42,055 |
| Ukrainians | 99.2 /100 | #90 | Exceptional $42,015 |
| Immigrants | Western Europe | 99.2 /100 | #91 | Exceptional $41,990 |
| Argentineans | 99.1 /100 | #92 | Exceptional $41,952 |
| Immigrants | Grenada | 99.0 /100 | #93 | Exceptional $41,932 |
| Moroccans | 98.9 /100 | #94 | Exceptional $41,872 |
| Immigrants | Netherlands | 98.9 /100 | #95 | Exceptional $41,870 |
Demographics Similar to Immigrants from Dominica by Median Female Earnings
In terms of median female earnings, the demographic groups most similar to Immigrants from Dominica are Welsh ($37,856, a difference of 0.080%), Immigrants from Iraq ($37,864, a difference of 0.10%), Alaskan Athabascan ($37,905, a difference of 0.21%), Swiss ($37,904, a difference of 0.21%), and Immigrants from Somalia ($37,914, a difference of 0.23%).
| Demographics | Rating | Rank | Median Female Earnings |
| Immigrants | Middle Africa | 2.7 /100 | #245 | Tragic $37,965 |
| Delaware | 2.6 /100 | #246 | Tragic $37,964 |
| Immigrants | Somalia | 2.4 /100 | #247 | Tragic $37,914 |
| Alaskan Athabascans | 2.3 /100 | #248 | Tragic $37,905 |
| Swiss | 2.3 /100 | #249 | Tragic $37,904 |
| Immigrants | Iraq | 2.2 /100 | #250 | Tragic $37,864 |
| Welsh | 2.1 /100 | #251 | Tragic $37,856 |
| Immigrants | Dominica | 2.0 /100 | #252 | Tragic $37,825 |
| Danes | 1.6 /100 | #253 | Tragic $37,730 |
| Whites/Caucasians | 1.1 /100 | #254 | Tragic $37,531 |
| Colville | 1.1 /100 | #255 | Tragic $37,514 |
| Samoans | 1.0 /100 | #256 | Tragic $37,498 |
| Hawaiians | 1.0 /100 | #257 | Tragic $37,497 |
| Belizeans | 0.9 /100 | #258 | Tragic $37,429 |
| Scotch-Irish | 0.8 /100 | #259 | Tragic $37,383 |