French American Indian vs Hmong Householder Income Ages 25 - 44 years
COMPARE
French American Indian
Hmong
Householder Income Ages 25 - 44 years
Householder Income Ages 25 - 44 years Comparison
French American Indians
Hmong
$85,899
HOUSEHOLDER INCOME AGES 25 - 44 YEARS
0.8/ 100
METRIC RATING
249th/ 347
METRIC RANK
$84,258
HOUSEHOLDER INCOME AGES 25 - 44 YEARS
0.3/ 100
METRIC RATING
267th/ 347
METRIC RANK
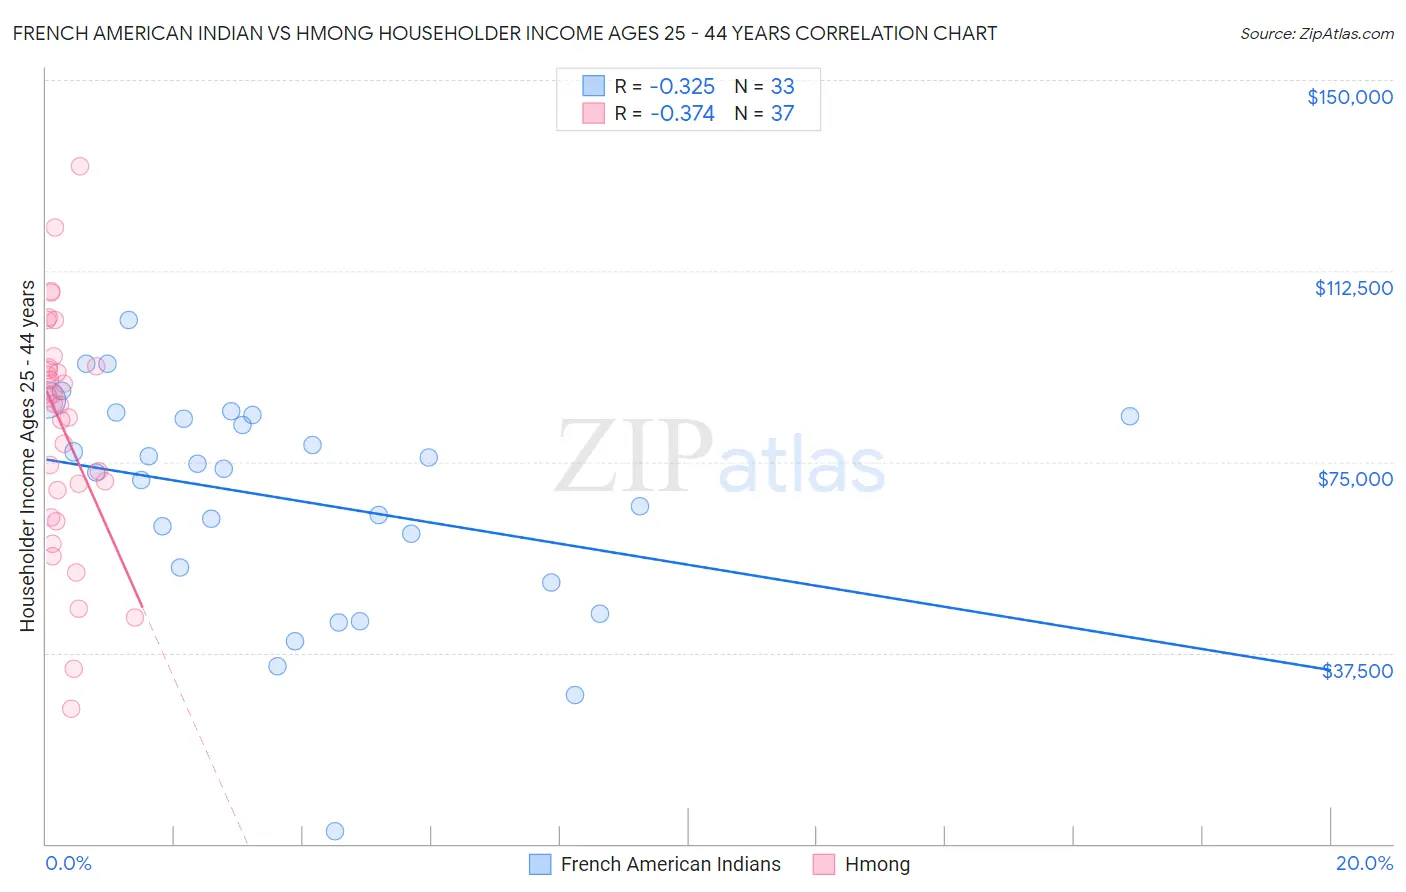
French American Indian vs Hmong Householder Income Ages 25 - 44 years Correlation Chart
The statistical analysis conducted on geographies consisting of 131,864,542 people shows a mild negative correlation between the proportion of French American Indians and household income with householder between the ages 25 and 44 in the United States with a correlation coefficient (R) of -0.325 and weighted average of $85,899. Similarly, the statistical analysis conducted on geographies consisting of 24,651,789 people shows a mild negative correlation between the proportion of Hmong and household income with householder between the ages 25 and 44 in the United States with a correlation coefficient (R) of -0.374 and weighted average of $84,258, a difference of 1.9%.
Householder Income Ages 25 - 44 years Correlation Summary
| Measurement | French American Indian | Hmong |
| Minimum | $2,499 | $26,488 |
| Maximum | $102,898 | $133,083 |
| Range | $100,399 | $106,595 |
| Mean | $67,668 | $81,379 |
| Median | $73,750 | $86,301 |
| Interquartile 25% (IQ1) | $52,805 | $66,711 |
| Interquartile 75% (IQ3) | $84,046 | $93,560 |
| Interquartile Range (IQR) | $31,241 | $26,850 |
| Standard Deviation (Sample) | $21,873 | $23,085 |
| Standard Deviation (Population) | $21,539 | $22,771 |
Demographics Similar to French American Indians and Hmong by Householder Income Ages 25 - 44 years
In terms of householder income ages 25 - 44 years, the demographic groups most similar to French American Indians are Pennsylvania German ($85,836, a difference of 0.070%), Cape Verdean ($85,758, a difference of 0.16%), Immigrants from Sudan ($86,109, a difference of 0.24%), Immigrants from Western Africa ($85,676, a difference of 0.26%), and British West Indian ($85,565, a difference of 0.39%). Similarly, the demographic groups most similar to Hmong are Subsaharan African ($84,235, a difference of 0.030%), Immigrants from Cabo Verde ($84,304, a difference of 0.050%), Sudanese ($84,401, a difference of 0.17%), Osage ($84,461, a difference of 0.24%), and Belizean ($84,534, a difference of 0.33%).
| Demographics | Rating | Rank | Householder Income Ages 25 - 44 years |
| Immigrants | Sudan | 0.9 /100 | #248 | Tragic $86,109 |
| French American Indians | 0.8 /100 | #249 | Tragic $85,899 |
| Pennsylvania Germans | 0.8 /100 | #250 | Tragic $85,836 |
| Cape Verdeans | 0.8 /100 | #251 | Tragic $85,758 |
| Immigrants | Western Africa | 0.7 /100 | #252 | Tragic $85,676 |
| British West Indians | 0.7 /100 | #253 | Tragic $85,565 |
| Immigrants | Laos | 0.7 /100 | #254 | Tragic $85,553 |
| German Russians | 0.6 /100 | #255 | Tragic $85,220 |
| Central Americans | 0.5 /100 | #256 | Tragic $85,144 |
| Mexican American Indians | 0.5 /100 | #257 | Tragic $85,066 |
| Immigrants | Nicaragua | 0.5 /100 | #258 | Tragic $84,914 |
| Immigrants | Senegal | 0.5 /100 | #259 | Tragic $84,848 |
| Americans | 0.4 /100 | #260 | Tragic $84,791 |
| Inupiat | 0.4 /100 | #261 | Tragic $84,619 |
| Cree | 0.4 /100 | #262 | Tragic $84,574 |
| Belizeans | 0.4 /100 | #263 | Tragic $84,534 |
| Osage | 0.4 /100 | #264 | Tragic $84,461 |
| Sudanese | 0.4 /100 | #265 | Tragic $84,401 |
| Immigrants | Cabo Verde | 0.3 /100 | #266 | Tragic $84,304 |
| Hmong | 0.3 /100 | #267 | Tragic $84,258 |
| Sub-Saharan Africans | 0.3 /100 | #268 | Tragic $84,235 |