French American Indian vs Immigrants from Peru Householder Income Ages 25 - 44 years
COMPARE
French American Indian
Immigrants from Peru
Householder Income Ages 25 - 44 years
Householder Income Ages 25 - 44 years Comparison
French American Indians
Immigrants from Peru
$85,899
HOUSEHOLDER INCOME AGES 25 - 44 YEARS
0.8/ 100
METRIC RATING
249th/ 347
METRIC RANK
$97,329
HOUSEHOLDER INCOME AGES 25 - 44 YEARS
82.2/ 100
METRIC RATING
139th/ 347
METRIC RANK
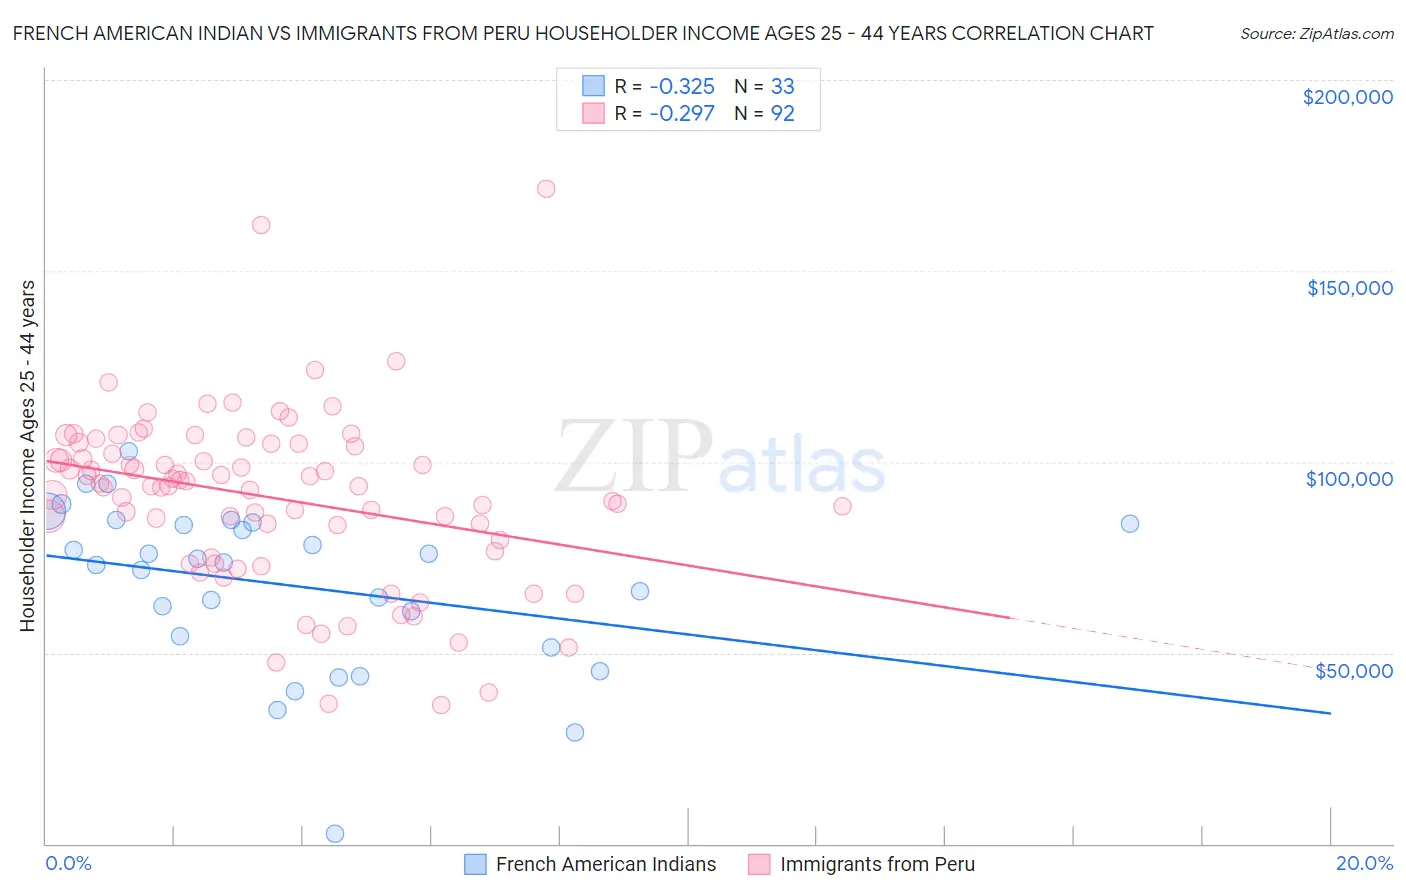
French American Indian vs Immigrants from Peru Householder Income Ages 25 - 44 years Correlation Chart
The statistical analysis conducted on geographies consisting of 131,864,542 people shows a mild negative correlation between the proportion of French American Indians and household income with householder between the ages 25 and 44 in the United States with a correlation coefficient (R) of -0.325 and weighted average of $85,899. Similarly, the statistical analysis conducted on geographies consisting of 328,285,431 people shows a weak negative correlation between the proportion of Immigrants from Peru and household income with householder between the ages 25 and 44 in the United States with a correlation coefficient (R) of -0.297 and weighted average of $97,329, a difference of 13.3%.
Householder Income Ages 25 - 44 years Correlation Summary
| Measurement | French American Indian | Immigrants from Peru |
| Minimum | $2,499 | $36,176 |
| Maximum | $102,898 | $171,373 |
| Range | $100,399 | $135,197 |
| Mean | $67,668 | $90,702 |
| Median | $73,750 | $93,723 |
| Interquartile 25% (IQ1) | $52,805 | $77,980 |
| Interquartile 75% (IQ3) | $84,046 | $104,309 |
| Interquartile Range (IQR) | $31,241 | $26,329 |
| Standard Deviation (Sample) | $21,873 | $22,743 |
| Standard Deviation (Population) | $21,539 | $22,619 |
Similar Demographics by Householder Income Ages 25 - 44 years
Demographics Similar to French American Indians by Householder Income Ages 25 - 44 years
In terms of householder income ages 25 - 44 years, the demographic groups most similar to French American Indians are Pennsylvania German ($85,836, a difference of 0.070%), Cape Verdean ($85,758, a difference of 0.16%), Immigrants from Sudan ($86,109, a difference of 0.24%), Immigrants from Western Africa ($85,676, a difference of 0.26%), and British West Indian ($85,565, a difference of 0.39%).
| Demographics | Rating | Rank | Householder Income Ages 25 - 44 years |
| West Indians | 1.7 /100 | #242 | Tragic $87,205 |
| Immigrants | West Indies | 1.5 /100 | #243 | Tragic $87,063 |
| Immigrants | Venezuela | 1.5 /100 | #244 | Tragic $87,038 |
| Immigrants | El Salvador | 1.4 /100 | #245 | Tragic $86,913 |
| Immigrants | Burma/Myanmar | 1.3 /100 | #246 | Tragic $86,736 |
| Immigrants | Nigeria | 1.2 /100 | #247 | Tragic $86,589 |
| Immigrants | Sudan | 0.9 /100 | #248 | Tragic $86,109 |
| French American Indians | 0.8 /100 | #249 | Tragic $85,899 |
| Pennsylvania Germans | 0.8 /100 | #250 | Tragic $85,836 |
| Cape Verdeans | 0.8 /100 | #251 | Tragic $85,758 |
| Immigrants | Western Africa | 0.7 /100 | #252 | Tragic $85,676 |
| British West Indians | 0.7 /100 | #253 | Tragic $85,565 |
| Immigrants | Laos | 0.7 /100 | #254 | Tragic $85,553 |
| German Russians | 0.6 /100 | #255 | Tragic $85,220 |
| Central Americans | 0.5 /100 | #256 | Tragic $85,144 |
Demographics Similar to Immigrants from Peru by Householder Income Ages 25 - 44 years
In terms of householder income ages 25 - 44 years, the demographic groups most similar to Immigrants from Peru are Lebanese ($97,339, a difference of 0.010%), Arab ($97,336, a difference of 0.010%), Immigrants from Morocco ($97,305, a difference of 0.020%), Luxembourger ($97,237, a difference of 0.090%), and Danish ($97,221, a difference of 0.11%).
| Demographics | Rating | Rank | Householder Income Ages 25 - 44 years |
| Immigrants | Zimbabwe | 86.3 /100 | #132 | Excellent $97,880 |
| Tsimshian | 85.8 /100 | #133 | Excellent $97,809 |
| Canadians | 84.5 /100 | #134 | Excellent $97,625 |
| Immigrants | Oceania | 84.5 /100 | #135 | Excellent $97,623 |
| Hungarians | 83.9 /100 | #136 | Excellent $97,544 |
| Lebanese | 82.3 /100 | #137 | Excellent $97,339 |
| Arabs | 82.3 /100 | #138 | Excellent $97,336 |
| Immigrants | Peru | 82.2 /100 | #139 | Excellent $97,329 |
| Immigrants | Morocco | 82.0 /100 | #140 | Excellent $97,305 |
| Luxembourgers | 81.5 /100 | #141 | Excellent $97,237 |
| Danes | 81.3 /100 | #142 | Excellent $97,221 |
| Immigrants | Jordan | 81.0 /100 | #143 | Excellent $97,185 |
| Immigrants | Chile | 80.8 /100 | #144 | Excellent $97,159 |
| Norwegians | 78.2 /100 | #145 | Good $96,866 |
| Ethiopians | 77.8 /100 | #146 | Good $96,824 |