Japanese vs Hmong Householder Income Ages 25 - 44 years
COMPARE
Japanese
Hmong
Householder Income Ages 25 - 44 years
Householder Income Ages 25 - 44 years Comparison
Japanese
Hmong
$91,624
HOUSEHOLDER INCOME AGES 25 - 44 YEARS
16.4/ 100
METRIC RATING
201st/ 347
METRIC RANK
$84,258
HOUSEHOLDER INCOME AGES 25 - 44 YEARS
0.3/ 100
METRIC RATING
267th/ 347
METRIC RANK
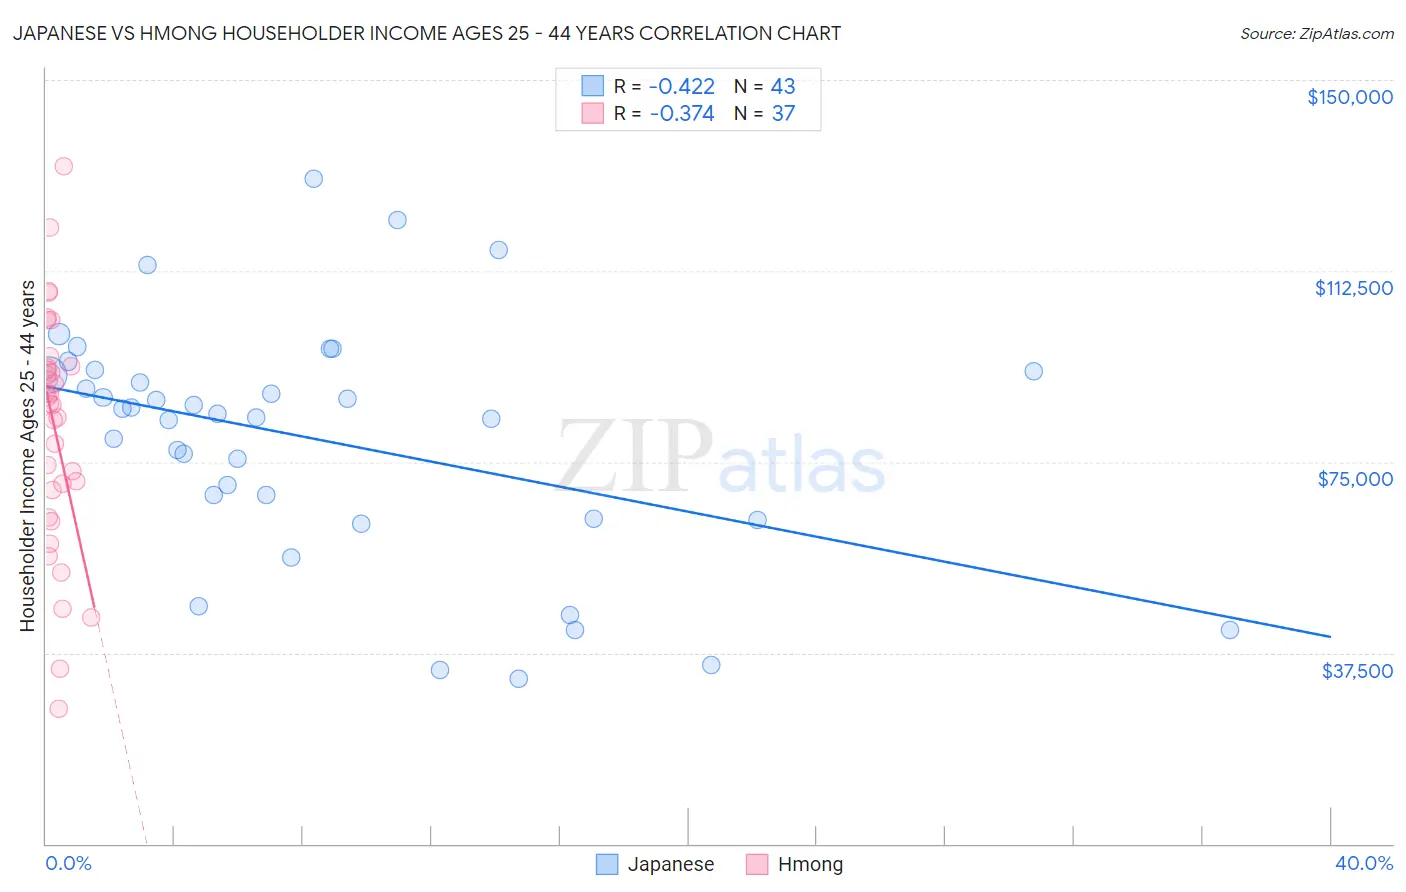
Japanese vs Hmong Householder Income Ages 25 - 44 years Correlation Chart
The statistical analysis conducted on geographies consisting of 248,932,234 people shows a moderate negative correlation between the proportion of Japanese and household income with householder between the ages 25 and 44 in the United States with a correlation coefficient (R) of -0.422 and weighted average of $91,624. Similarly, the statistical analysis conducted on geographies consisting of 24,651,789 people shows a mild negative correlation between the proportion of Hmong and household income with householder between the ages 25 and 44 in the United States with a correlation coefficient (R) of -0.374 and weighted average of $84,258, a difference of 8.7%.
Householder Income Ages 25 - 44 years Correlation Summary
| Measurement | Japanese | Hmong |
| Minimum | $32,434 | $26,488 |
| Maximum | $130,694 | $133,083 |
| Range | $98,260 | $106,595 |
| Mean | $79,326 | $81,379 |
| Median | $84,545 | $86,301 |
| Interquartile 25% (IQ1) | $63,836 | $66,711 |
| Interquartile 75% (IQ3) | $92,776 | $93,560 |
| Interquartile Range (IQR) | $28,940 | $26,850 |
| Standard Deviation (Sample) | $23,298 | $23,085 |
| Standard Deviation (Population) | $23,025 | $22,771 |
Similar Demographics by Householder Income Ages 25 - 44 years
Demographics Similar to Japanese by Householder Income Ages 25 - 44 years
In terms of householder income ages 25 - 44 years, the demographic groups most similar to Japanese are White/Caucasian ($91,668, a difference of 0.050%), Ecuadorian ($91,574, a difference of 0.050%), Kenyan ($91,684, a difference of 0.070%), Immigrants from Cambodia ($91,533, a difference of 0.10%), and Nepalese ($91,498, a difference of 0.14%).
| Demographics | Rating | Rank | Householder Income Ages 25 - 44 years |
| Immigrants | Azores | 22.4 /100 | #194 | Fair $92,322 |
| Celtics | 21.6 /100 | #195 | Fair $92,241 |
| Immigrants | Colombia | 21.3 /100 | #196 | Fair $92,204 |
| Spanish | 21.2 /100 | #197 | Fair $92,200 |
| Vietnamese | 20.2 /100 | #198 | Fair $92,089 |
| Kenyans | 16.8 /100 | #199 | Poor $91,684 |
| Whites/Caucasians | 16.7 /100 | #200 | Poor $91,668 |
| Japanese | 16.4 /100 | #201 | Poor $91,624 |
| Ecuadorians | 16.0 /100 | #202 | Poor $91,574 |
| Immigrants | Cambodia | 15.7 /100 | #203 | Poor $91,533 |
| Nepalese | 15.4 /100 | #204 | Poor $91,498 |
| Immigrants | Eastern Africa | 15.2 /100 | #205 | Poor $91,458 |
| Aleuts | 14.5 /100 | #206 | Poor $91,370 |
| Yugoslavians | 14.5 /100 | #207 | Poor $91,368 |
| Immigrants | Thailand | 14.3 /100 | #208 | Poor $91,337 |
Demographics Similar to Hmong by Householder Income Ages 25 - 44 years
In terms of householder income ages 25 - 44 years, the demographic groups most similar to Hmong are Subsaharan African ($84,235, a difference of 0.030%), Immigrants from Cabo Verde ($84,304, a difference of 0.050%), Sudanese ($84,401, a difference of 0.17%), Spanish American Indian ($84,085, a difference of 0.21%), and Osage ($84,461, a difference of 0.24%).
| Demographics | Rating | Rank | Householder Income Ages 25 - 44 years |
| Americans | 0.4 /100 | #260 | Tragic $84,791 |
| Inupiat | 0.4 /100 | #261 | Tragic $84,619 |
| Cree | 0.4 /100 | #262 | Tragic $84,574 |
| Belizeans | 0.4 /100 | #263 | Tragic $84,534 |
| Osage | 0.4 /100 | #264 | Tragic $84,461 |
| Sudanese | 0.4 /100 | #265 | Tragic $84,401 |
| Immigrants | Cabo Verde | 0.3 /100 | #266 | Tragic $84,304 |
| Hmong | 0.3 /100 | #267 | Tragic $84,258 |
| Sub-Saharan Africans | 0.3 /100 | #268 | Tragic $84,235 |
| Spanish American Indians | 0.3 /100 | #269 | Tragic $84,085 |
| Jamaicans | 0.3 /100 | #270 | Tragic $83,933 |
| Somalis | 0.2 /100 | #271 | Tragic $83,752 |
| Spanish Americans | 0.2 /100 | #272 | Tragic $83,722 |
| Iroquois | 0.2 /100 | #273 | Tragic $83,682 |
| Marshallese | 0.2 /100 | #274 | Tragic $83,575 |