Immigrants from Guyana vs Hmong Householder Income Ages 25 - 44 years
COMPARE
Immigrants from Guyana
Hmong
Householder Income Ages 25 - 44 years
Householder Income Ages 25 - 44 years Comparison
Immigrants from Guyana
Hmong
$89,586
HOUSEHOLDER INCOME AGES 25 - 44 YEARS
5.9/ 100
METRIC RATING
223rd/ 347
METRIC RANK
$84,258
HOUSEHOLDER INCOME AGES 25 - 44 YEARS
0.3/ 100
METRIC RATING
267th/ 347
METRIC RANK
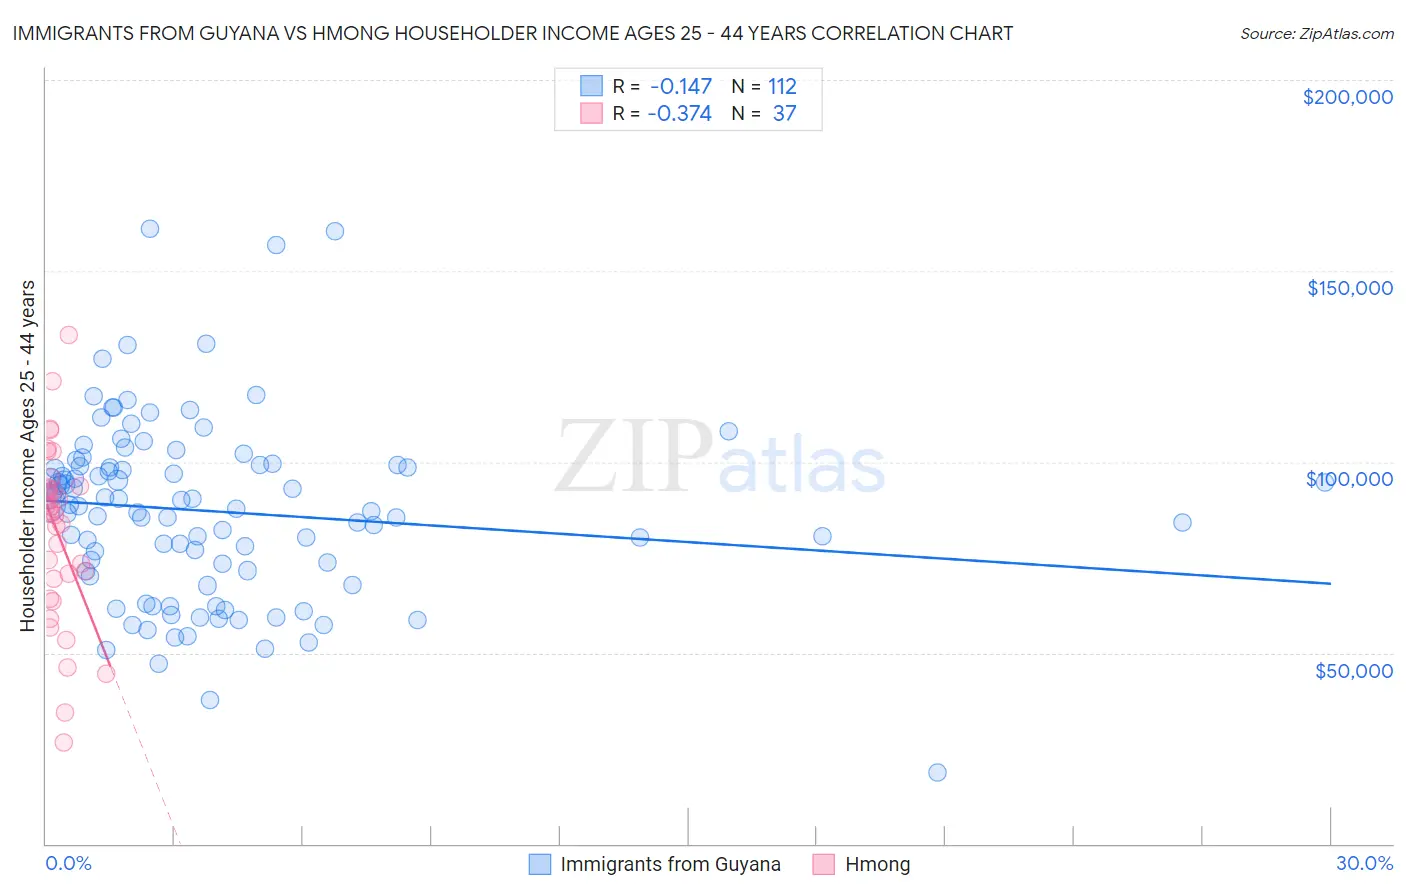
Immigrants from Guyana vs Hmong Householder Income Ages 25 - 44 years Correlation Chart
The statistical analysis conducted on geographies consisting of 183,521,804 people shows a poor negative correlation between the proportion of Immigrants from Guyana and household income with householder between the ages 25 and 44 in the United States with a correlation coefficient (R) of -0.147 and weighted average of $89,586. Similarly, the statistical analysis conducted on geographies consisting of 24,651,789 people shows a mild negative correlation between the proportion of Hmong and household income with householder between the ages 25 and 44 in the United States with a correlation coefficient (R) of -0.374 and weighted average of $84,258, a difference of 6.3%.
Householder Income Ages 25 - 44 years Correlation Summary
| Measurement | Immigrants from Guyana | Hmong |
| Minimum | $18,657 | $26,488 |
| Maximum | $161,089 | $133,083 |
| Range | $142,432 | $106,595 |
| Mean | $87,058 | $81,379 |
| Median | $88,583 | $86,301 |
| Interquartile 25% (IQ1) | $71,493 | $66,711 |
| Interquartile 75% (IQ3) | $98,895 | $93,560 |
| Interquartile Range (IQR) | $27,402 | $26,850 |
| Standard Deviation (Sample) | $23,727 | $23,085 |
| Standard Deviation (Population) | $23,620 | $22,771 |
Similar Demographics by Householder Income Ages 25 - 44 years
Demographics Similar to Immigrants from Guyana by Householder Income Ages 25 - 44 years
In terms of householder income ages 25 - 44 years, the demographic groups most similar to Immigrants from Guyana are Barbadian ($89,565, a difference of 0.020%), Immigrants from Ecuador ($89,673, a difference of 0.10%), Immigrants from Panama ($89,451, a difference of 0.15%), Immigrants from Iraq ($89,444, a difference of 0.16%), and Immigrants from Trinidad and Tobago ($89,748, a difference of 0.18%).
| Demographics | Rating | Rank | Householder Income Ages 25 - 44 years |
| Ghanaians | 7.9 /100 | #216 | Tragic $90,137 |
| Scotch-Irish | 7.3 /100 | #217 | Tragic $89,969 |
| Guyanese | 7.1 /100 | #218 | Tragic $89,940 |
| Delaware | 6.9 /100 | #219 | Tragic $89,876 |
| Trinidadians and Tobagonians | 6.8 /100 | #220 | Tragic $89,856 |
| Immigrants | Trinidad and Tobago | 6.5 /100 | #221 | Tragic $89,748 |
| Immigrants | Ecuador | 6.2 /100 | #222 | Tragic $89,673 |
| Immigrants | Guyana | 5.9 /100 | #223 | Tragic $89,586 |
| Barbadians | 5.9 /100 | #224 | Tragic $89,565 |
| Immigrants | Panama | 5.5 /100 | #225 | Tragic $89,451 |
| Immigrants | Iraq | 5.5 /100 | #226 | Tragic $89,444 |
| Immigrants | St. Vincent and the Grenadines | 4.1 /100 | #227 | Tragic $88,888 |
| Immigrants | Bosnia and Herzegovina | 4.0 /100 | #228 | Tragic $88,819 |
| Immigrants | Barbados | 3.7 /100 | #229 | Tragic $88,687 |
| Alaskan Athabascans | 3.3 /100 | #230 | Tragic $88,446 |
Demographics Similar to Hmong by Householder Income Ages 25 - 44 years
In terms of householder income ages 25 - 44 years, the demographic groups most similar to Hmong are Subsaharan African ($84,235, a difference of 0.030%), Immigrants from Cabo Verde ($84,304, a difference of 0.050%), Sudanese ($84,401, a difference of 0.17%), Spanish American Indian ($84,085, a difference of 0.21%), and Osage ($84,461, a difference of 0.24%).
| Demographics | Rating | Rank | Householder Income Ages 25 - 44 years |
| Americans | 0.4 /100 | #260 | Tragic $84,791 |
| Inupiat | 0.4 /100 | #261 | Tragic $84,619 |
| Cree | 0.4 /100 | #262 | Tragic $84,574 |
| Belizeans | 0.4 /100 | #263 | Tragic $84,534 |
| Osage | 0.4 /100 | #264 | Tragic $84,461 |
| Sudanese | 0.4 /100 | #265 | Tragic $84,401 |
| Immigrants | Cabo Verde | 0.3 /100 | #266 | Tragic $84,304 |
| Hmong | 0.3 /100 | #267 | Tragic $84,258 |
| Sub-Saharan Africans | 0.3 /100 | #268 | Tragic $84,235 |
| Spanish American Indians | 0.3 /100 | #269 | Tragic $84,085 |
| Jamaicans | 0.3 /100 | #270 | Tragic $83,933 |
| Somalis | 0.2 /100 | #271 | Tragic $83,752 |
| Spanish Americans | 0.2 /100 | #272 | Tragic $83,722 |
| Iroquois | 0.2 /100 | #273 | Tragic $83,682 |
| Marshallese | 0.2 /100 | #274 | Tragic $83,575 |