Filipino vs Hungarian Professional Degree
COMPARE
Filipino
Hungarian
Professional Degree
Professional Degree Comparison
Filipinos
Hungarians
7.6%
PROFESSIONAL DEGREE
100.0/ 100
METRIC RATING
4th/ 347
METRIC RANK
4.6%
PROFESSIONAL DEGREE
80.8/ 100
METRIC RATING
143rd/ 347
METRIC RANK
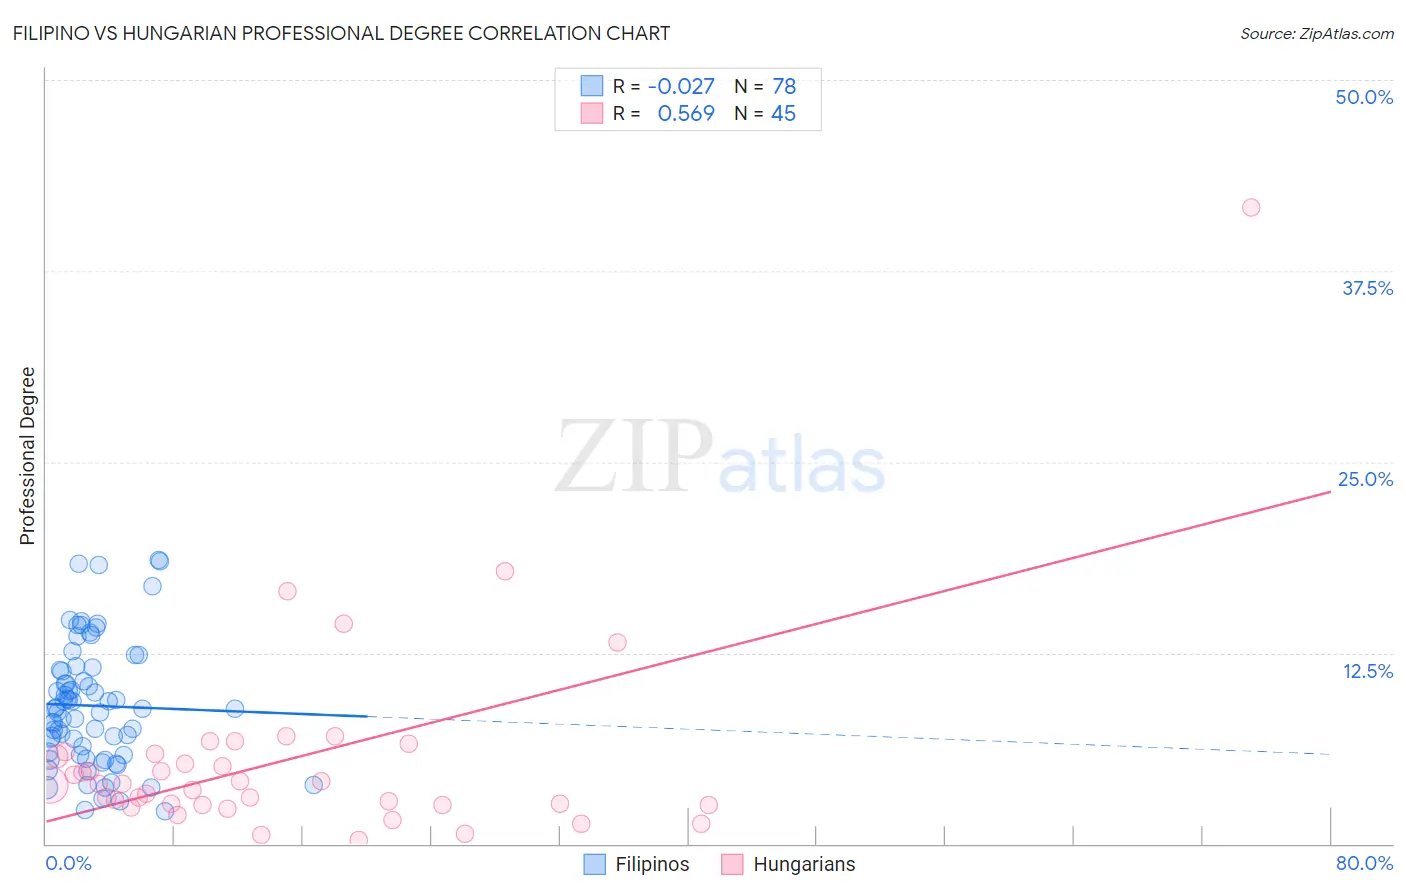
Filipino vs Hungarian Professional Degree Correlation Chart
The statistical analysis conducted on geographies consisting of 254,169,357 people shows no correlation between the proportion of Filipinos and percentage of population with at least professional degree education in the United States with a correlation coefficient (R) of -0.027 and weighted average of 7.6%. Similarly, the statistical analysis conducted on geographies consisting of 483,808,546 people shows a substantial positive correlation between the proportion of Hungarians and percentage of population with at least professional degree education in the United States with a correlation coefficient (R) of 0.569 and weighted average of 4.6%, a difference of 63.1%.
Professional Degree Correlation Summary
| Measurement | Filipino | Hungarian |
| Minimum | 2.1% | 0.21% |
| Maximum | 18.6% | 41.7% |
| Range | 16.5% | 41.5% |
| Mean | 9.0% | 5.6% |
| Median | 8.8% | 3.9% |
| Interquartile 25% (IQ1) | 5.8% | 2.5% |
| Interquartile 75% (IQ3) | 11.4% | 5.9% |
| Interquartile Range (IQR) | 5.5% | 3.4% |
| Standard Deviation (Sample) | 4.0% | 6.7% |
| Standard Deviation (Population) | 4.0% | 6.6% |
Similar Demographics by Professional Degree
Demographics Similar to Filipinos by Professional Degree
In terms of professional degree, the demographic groups most similar to Filipinos are Iranian (7.6%, a difference of 0.77%), Immigrants from Singapore (7.7%, a difference of 2.4%), Immigrants from Iran (7.3%, a difference of 3.2%), Okinawan (7.3%, a difference of 3.4%), and Immigrants from Israel (7.9%, a difference of 3.9%).
| Demographics | Rating | Rank | Professional Degree |
| Immigrants | Israel | 100.0 /100 | #1 | Exceptional 7.9% |
| Immigrants | Singapore | 100.0 /100 | #2 | Exceptional 7.7% |
| Iranians | 100.0 /100 | #3 | Exceptional 7.6% |
| Filipinos | 100.0 /100 | #4 | Exceptional 7.6% |
| Immigrants | Iran | 100.0 /100 | #5 | Exceptional 7.3% |
| Okinawans | 100.0 /100 | #6 | Exceptional 7.3% |
| Eastern Europeans | 100.0 /100 | #7 | Exceptional 7.1% |
| Immigrants | Switzerland | 100.0 /100 | #8 | Exceptional 7.1% |
| Immigrants | Taiwan | 100.0 /100 | #9 | Exceptional 7.1% |
| Immigrants | Belgium | 100.0 /100 | #10 | Exceptional 7.0% |
| Cypriots | 100.0 /100 | #11 | Exceptional 6.9% |
| Israelis | 100.0 /100 | #12 | Exceptional 6.9% |
| Immigrants | Australia | 100.0 /100 | #13 | Exceptional 6.9% |
| Immigrants | France | 100.0 /100 | #14 | Exceptional 6.8% |
| Immigrants | China | 100.0 /100 | #15 | Exceptional 6.7% |
Demographics Similar to Hungarians by Professional Degree
In terms of professional degree, the demographic groups most similar to Hungarians are Immigrants from South America (4.6%, a difference of 0.070%), Sudanese (4.6%, a difference of 0.11%), Uruguayan (4.6%, a difference of 0.13%), Basque (4.6%, a difference of 0.24%), and Luxembourger (4.6%, a difference of 0.44%).
| Demographics | Rating | Rank | Professional Degree |
| Immigrants | Jordan | 89.0 /100 | #136 | Excellent 4.7% |
| Jordanians | 88.9 /100 | #137 | Excellent 4.7% |
| Afghans | 88.8 /100 | #138 | Excellent 4.7% |
| South Americans | 85.6 /100 | #139 | Excellent 4.7% |
| Canadians | 84.4 /100 | #140 | Excellent 4.7% |
| Basques | 81.8 /100 | #141 | Excellent 4.6% |
| Sudanese | 81.3 /100 | #142 | Excellent 4.6% |
| Hungarians | 80.8 /100 | #143 | Excellent 4.6% |
| Immigrants | South America | 80.5 /100 | #144 | Excellent 4.6% |
| Uruguayans | 80.2 /100 | #145 | Excellent 4.6% |
| Luxembourgers | 78.7 /100 | #146 | Good 4.6% |
| Colombians | 77.7 /100 | #147 | Good 4.6% |
| Slovenes | 76.1 /100 | #148 | Good 4.6% |
| Senegalese | 75.3 /100 | #149 | Good 4.6% |
| Immigrants | Oceania | 73.4 /100 | #150 | Good 4.6% |