Filipino vs Creek 4th Grade
COMPARE
Filipino
Creek
4th Grade
4th Grade Comparison
Filipinos
Creek
97.7%
4TH GRADE
84.0/ 100
METRIC RATING
140th/ 347
METRIC RANK
98.1%
4TH GRADE
99.8/ 100
METRIC RATING
58th/ 347
METRIC RANK
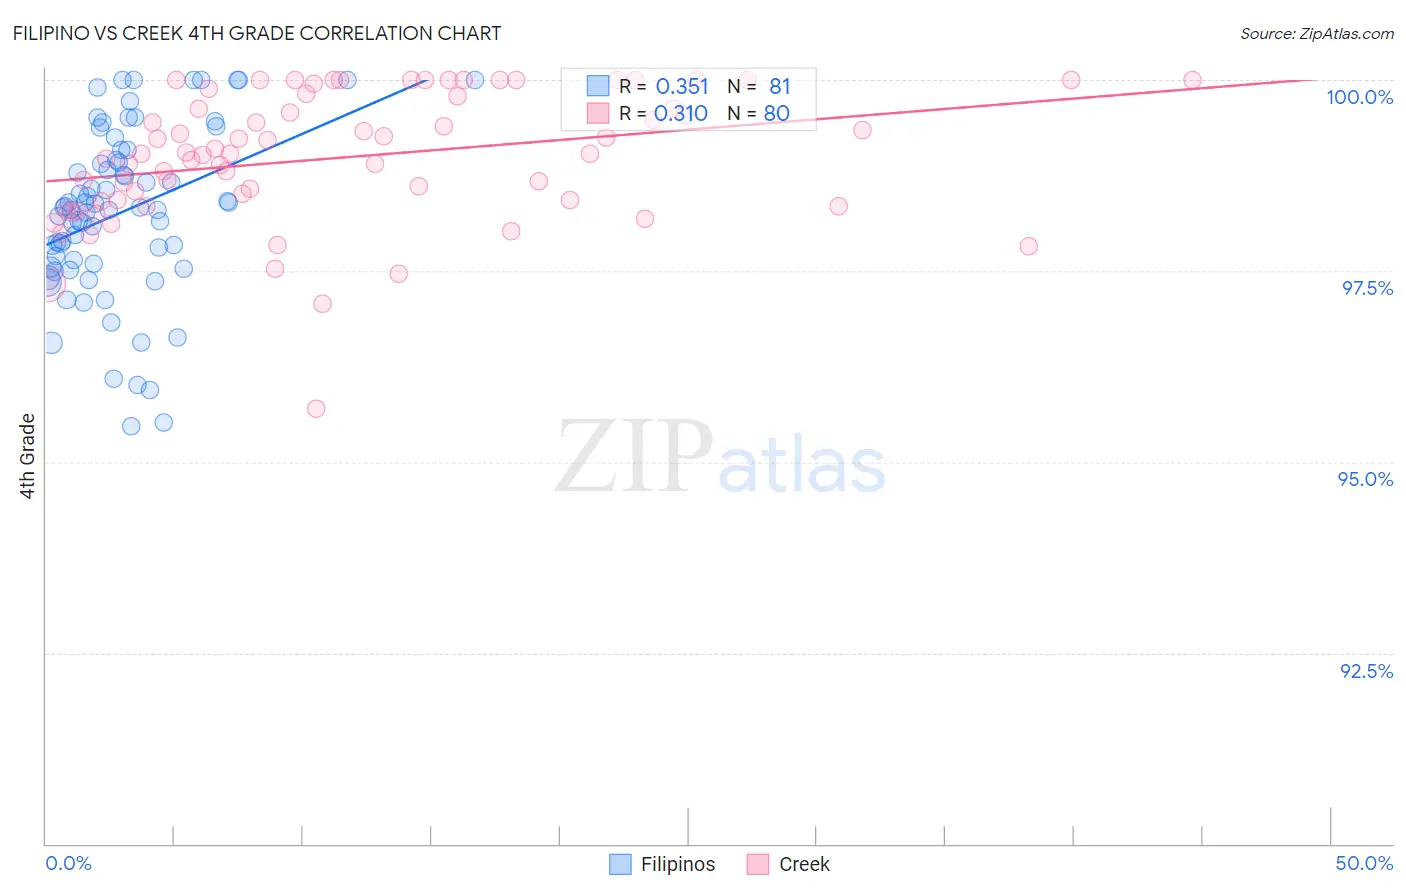
Filipino vs Creek 4th Grade Correlation Chart
The statistical analysis conducted on geographies consisting of 254,351,427 people shows a mild positive correlation between the proportion of Filipinos and percentage of population with at least 4th grade education in the United States with a correlation coefficient (R) of 0.351 and weighted average of 97.7%. Similarly, the statistical analysis conducted on geographies consisting of 178,480,663 people shows a mild positive correlation between the proportion of Creek and percentage of population with at least 4th grade education in the United States with a correlation coefficient (R) of 0.310 and weighted average of 98.1%, a difference of 0.42%.
4th Grade Correlation Summary
| Measurement | Filipino | Creek |
| Minimum | 95.5% | 95.7% |
| Maximum | 100.0% | 100.0% |
| Range | 4.5% | 4.3% |
| Mean | 98.3% | 99.0% |
| Median | 98.3% | 99.0% |
| Interquartile 25% (IQ1) | 97.6% | 98.4% |
| Interquartile 75% (IQ3) | 99.0% | 99.8% |
| Interquartile Range (IQR) | 1.4% | 1.4% |
| Standard Deviation (Sample) | 1.1% | 0.86% |
| Standard Deviation (Population) | 1.1% | 0.85% |
Similar Demographics by 4th Grade
Demographics Similar to Filipinos by 4th Grade
In terms of 4th grade, the demographic groups most similar to Filipinos are Seminole (97.7%, a difference of 0.0%), Immigrants from Greece (97.7%, a difference of 0.0%), Immigrants from Turkey (97.7%, a difference of 0.010%), Blackfeet (97.7%, a difference of 0.010%), and Immigrants from North Macedonia (97.7%, a difference of 0.010%).
| Demographics | Rating | Rank | 4th Grade |
| Hmong | 88.2 /100 | #133 | Excellent 97.7% |
| Palestinians | 88.1 /100 | #134 | Excellent 97.7% |
| Cambodians | 87.8 /100 | #135 | Excellent 97.7% |
| Israelis | 86.2 /100 | #136 | Excellent 97.7% |
| Immigrants | Turkey | 86.0 /100 | #137 | Excellent 97.7% |
| Blackfeet | 86.0 /100 | #138 | Excellent 97.7% |
| Seminole | 84.7 /100 | #139 | Excellent 97.7% |
| Filipinos | 84.0 /100 | #140 | Excellent 97.7% |
| Immigrants | Greece | 83.8 /100 | #141 | Excellent 97.7% |
| Immigrants | North Macedonia | 83.3 /100 | #142 | Excellent 97.7% |
| Burmese | 82.8 /100 | #143 | Excellent 97.7% |
| Spaniards | 82.7 /100 | #144 | Excellent 97.7% |
| Immigrants | Moldova | 82.4 /100 | #145 | Excellent 97.7% |
| Jordanians | 81.3 /100 | #146 | Excellent 97.7% |
| Ute | 80.6 /100 | #147 | Excellent 97.7% |
Demographics Similar to Creek by 4th Grade
In terms of 4th grade, the demographic groups most similar to Creek are Greek (98.1%, a difference of 0.0%), Austrian (98.1%, a difference of 0.0%), Australian (98.1%, a difference of 0.010%), Slavic (98.1%, a difference of 0.010%), and Maltese (98.1%, a difference of 0.010%).
| Demographics | Rating | Rank | 4th Grade |
| Celtics | 99.8 /100 | #51 | Exceptional 98.1% |
| Australians | 99.8 /100 | #52 | Exceptional 98.1% |
| Slavs | 99.8 /100 | #53 | Exceptional 98.1% |
| Maltese | 99.8 /100 | #54 | Exceptional 98.1% |
| Whites/Caucasians | 99.8 /100 | #55 | Exceptional 98.1% |
| Greeks | 99.8 /100 | #56 | Exceptional 98.1% |
| Austrians | 99.8 /100 | #57 | Exceptional 98.1% |
| Creek | 99.8 /100 | #58 | Exceptional 98.1% |
| Americans | 99.8 /100 | #59 | Exceptional 98.1% |
| Immigrants | Canada | 99.7 /100 | #60 | Exceptional 98.1% |
| Immigrants | North America | 99.7 /100 | #61 | Exceptional 98.1% |
| Serbians | 99.7 /100 | #62 | Exceptional 98.1% |
| Russians | 99.7 /100 | #63 | Exceptional 98.0% |
| Cajuns | 99.7 /100 | #64 | Exceptional 98.0% |
| Immigrants | Northern Europe | 99.6 /100 | #65 | Exceptional 98.0% |