European vs Arapaho Median Female Earnings
COMPARE
European
Arapaho
Median Female Earnings
Median Female Earnings Comparison
Europeans
Arapaho
$39,457
MEDIAN FEMALE EARNINGS
37.7/ 100
METRIC RATING
184th/ 347
METRIC RANK
$31,489
MEDIAN FEMALE EARNINGS
0.0/ 100
METRIC RATING
346th/ 347
METRIC RANK
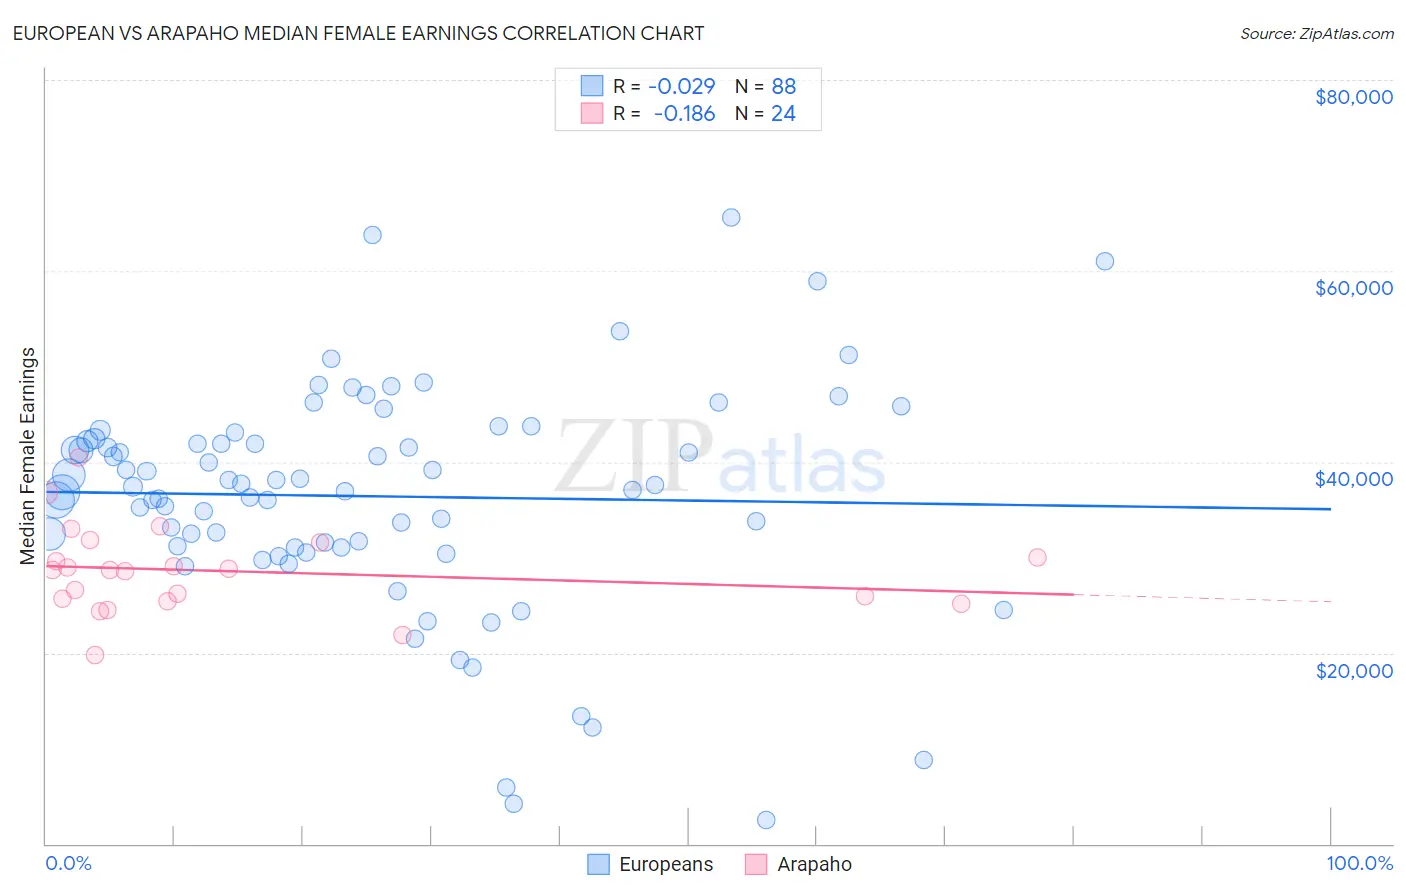
European vs Arapaho Median Female Earnings Correlation Chart
The statistical analysis conducted on geographies consisting of 560,435,865 people shows no correlation between the proportion of Europeans and median female earnings in the United States with a correlation coefficient (R) of -0.029 and weighted average of $39,457. Similarly, the statistical analysis conducted on geographies consisting of 29,776,290 people shows a poor negative correlation between the proportion of Arapaho and median female earnings in the United States with a correlation coefficient (R) of -0.186 and weighted average of $31,489, a difference of 25.3%.
Median Female Earnings Correlation Summary
| Measurement | European | Arapaho |
| Minimum | $2,499 | $19,750 |
| Maximum | $65,560 | $40,452 |
| Range | $63,061 | $20,702 |
| Mean | $36,392 | $28,528 |
| Median | $37,518 | $28,660 |
| Interquartile 25% (IQ1) | $31,126 | $25,558 |
| Interquartile 75% (IQ3) | $42,307 | $30,782 |
| Interquartile Range (IQR) | $11,181 | $5,224 |
| Standard Deviation (Sample) | $11,839 | $4,555 |
| Standard Deviation (Population) | $11,771 | $4,459 |
Similar Demographics by Median Female Earnings
Demographics Similar to Europeans by Median Female Earnings
In terms of median female earnings, the demographic groups most similar to Europeans are Immigrants from West Indies ($39,441, a difference of 0.040%), Colombian ($39,439, a difference of 0.040%), Swedish ($39,421, a difference of 0.090%), Bermudan ($39,418, a difference of 0.10%), and Hungarian ($39,510, a difference of 0.13%).
| Demographics | Rating | Rank | Median Female Earnings |
| Costa Ricans | 46.1 /100 | #177 | Average $39,622 |
| Slavs | 45.6 /100 | #178 | Average $39,613 |
| Immigrants | Germany | 45.1 /100 | #179 | Average $39,603 |
| Immigrants | Kenya | 41.6 /100 | #180 | Average $39,535 |
| Tsimshian | 41.4 /100 | #181 | Average $39,530 |
| Tlingit-Haida | 40.5 /100 | #182 | Average $39,513 |
| Hungarians | 40.3 /100 | #183 | Average $39,510 |
| Europeans | 37.7 /100 | #184 | Fair $39,457 |
| Immigrants | West Indies | 36.9 /100 | #185 | Fair $39,441 |
| Colombians | 36.9 /100 | #186 | Fair $39,439 |
| Swedes | 36.0 /100 | #187 | Fair $39,421 |
| Bermudans | 35.9 /100 | #188 | Fair $39,418 |
| Senegalese | 34.2 /100 | #189 | Fair $39,384 |
| Puget Sound Salish | 33.9 /100 | #190 | Fair $39,376 |
| Immigrants | Western Africa | 32.7 /100 | #191 | Fair $39,351 |
Demographics Similar to Arapaho by Median Female Earnings
In terms of median female earnings, the demographic groups most similar to Arapaho are Puerto Rican ($31,560, a difference of 0.23%), Lumbee ($32,500, a difference of 3.2%), Pueblo ($32,564, a difference of 3.4%), Houma ($30,343, a difference of 3.8%), and Yup'ik ($32,730, a difference of 3.9%).
| Demographics | Rating | Rank | Median Female Earnings |
| Mexicans | 0.0 /100 | #333 | Tragic $33,664 |
| Spanish American Indians | 0.0 /100 | #334 | Tragic $33,625 |
| Creek | 0.0 /100 | #335 | Tragic $33,437 |
| Ottawa | 0.0 /100 | #336 | Tragic $33,378 |
| Yakama | 0.0 /100 | #337 | Tragic $33,354 |
| Immigrants | Cuba | 0.0 /100 | #338 | Tragic $33,291 |
| Immigrants | Mexico | 0.0 /100 | #339 | Tragic $33,236 |
| Tohono O'odham | 0.0 /100 | #340 | Tragic $33,205 |
| Navajo | 0.0 /100 | #341 | Tragic $33,046 |
| Yup'ik | 0.0 /100 | #342 | Tragic $32,730 |
| Pueblo | 0.0 /100 | #343 | Tragic $32,564 |
| Lumbee | 0.0 /100 | #344 | Tragic $32,500 |
| Puerto Ricans | 0.0 /100 | #345 | Tragic $31,560 |
| Arapaho | 0.0 /100 | #346 | Tragic $31,489 |
| Houma | 0.0 /100 | #347 | Tragic $30,343 |