Ethiopian vs Ute Householder Income Under 25 years
COMPARE
Ethiopian
Ute
Householder Income Under 25 years
Householder Income Under 25 years Comparison
Ethiopians
Ute
$53,818
HOUSEHOLDER INCOME UNDER 25 YEARS
98.2/ 100
METRIC RATING
104th/ 347
METRIC RANK
$49,997
HOUSEHOLDER INCOME UNDER 25 YEARS
0.5/ 100
METRIC RATING
269th/ 347
METRIC RANK
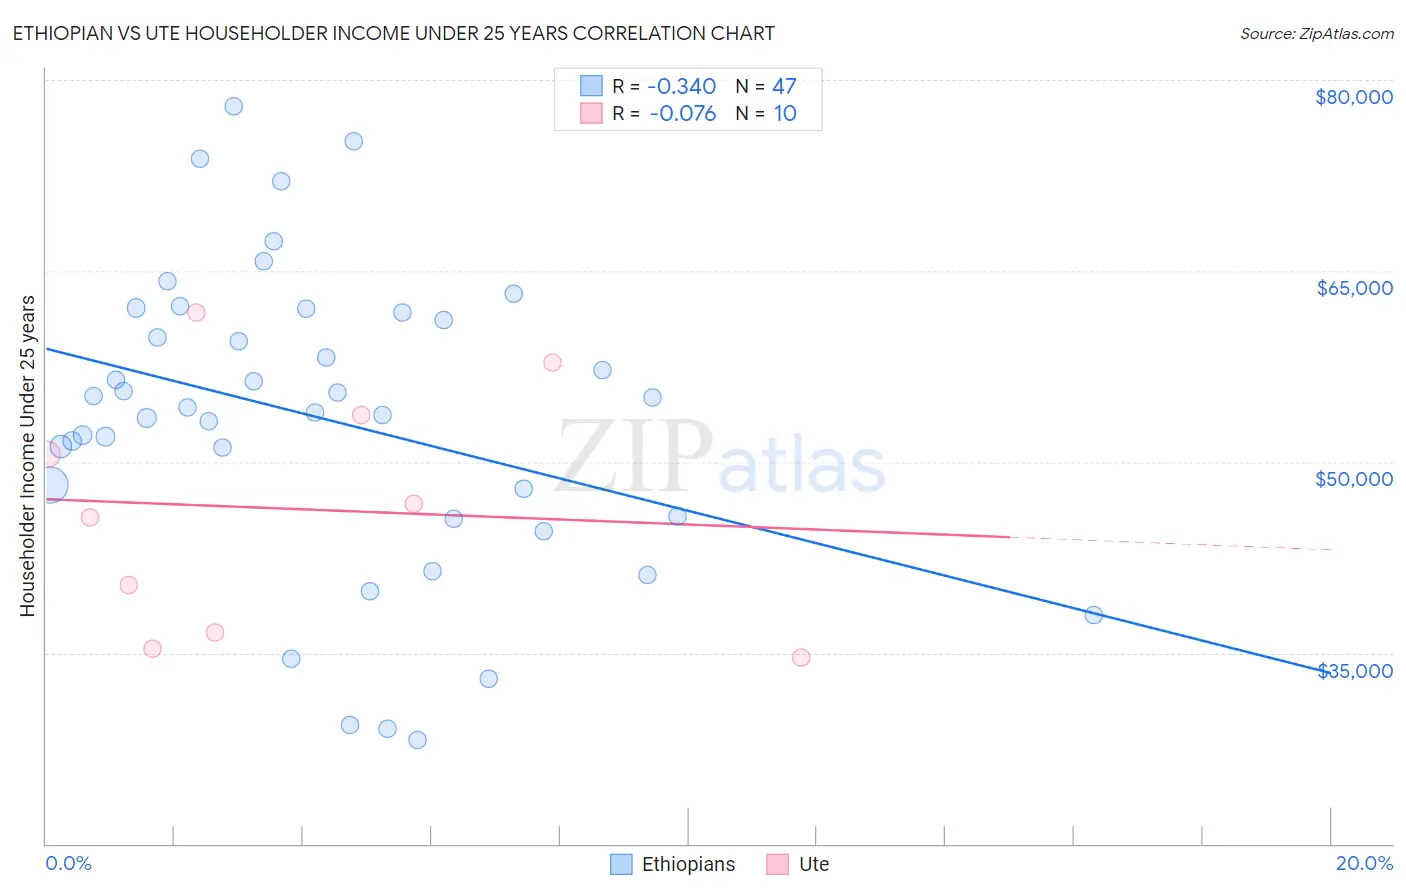
Ethiopian vs Ute Householder Income Under 25 years Correlation Chart
The statistical analysis conducted on geographies consisting of 201,530,773 people shows a mild negative correlation between the proportion of Ethiopians and household income with householder under the age of 25 in the United States with a correlation coefficient (R) of -0.340 and weighted average of $53,818. Similarly, the statistical analysis conducted on geographies consisting of 53,586,757 people shows a slight negative correlation between the proportion of Ute and household income with householder under the age of 25 in the United States with a correlation coefficient (R) of -0.076 and weighted average of $49,997, a difference of 7.6%.
Householder Income Under 25 years Correlation Summary
| Measurement | Ethiopian | Ute |
| Minimum | $28,125 | $34,583 |
| Maximum | $77,898 | $61,768 |
| Range | $49,773 | $27,185 |
| Mean | $53,404 | $46,291 |
| Median | $54,292 | $46,136 |
| Interquartile 25% (IQ1) | $45,695 | $36,563 |
| Interquartile 75% (IQ3) | $61,784 | $53,646 |
| Interquartile Range (IQR) | $16,089 | $17,083 |
| Standard Deviation (Sample) | $11,871 | $9,620 |
| Standard Deviation (Population) | $11,744 | $9,126 |
Similar Demographics by Householder Income Under 25 years
Demographics Similar to Ethiopians by Householder Income Under 25 years
In terms of householder income under 25 years, the demographic groups most similar to Ethiopians are Immigrants from France ($53,805, a difference of 0.020%), Ukrainian ($53,843, a difference of 0.050%), Albanian ($53,794, a difference of 0.050%), Australian ($53,739, a difference of 0.15%), and Maltese ($53,735, a difference of 0.15%).
| Demographics | Rating | Rank | Householder Income Under 25 years |
| Immigrants | Portugal | 99.1 /100 | #97 | Exceptional $54,105 |
| Eastern Europeans | 99.0 /100 | #98 | Exceptional $54,066 |
| Alaska Natives | 98.8 /100 | #99 | Exceptional $54,000 |
| Immigrants | Kazakhstan | 98.8 /100 | #100 | Exceptional $53,990 |
| South Americans | 98.6 /100 | #101 | Exceptional $53,939 |
| Ecuadorians | 98.5 /100 | #102 | Exceptional $53,911 |
| Ukrainians | 98.3 /100 | #103 | Exceptional $53,843 |
| Ethiopians | 98.2 /100 | #104 | Exceptional $53,818 |
| Immigrants | France | 98.1 /100 | #105 | Exceptional $53,805 |
| Albanians | 98.1 /100 | #106 | Exceptional $53,794 |
| Australians | 97.8 /100 | #107 | Exceptional $53,739 |
| Maltese | 97.8 /100 | #108 | Exceptional $53,735 |
| Immigrants | Ecuador | 97.7 /100 | #109 | Exceptional $53,722 |
| Greeks | 97.7 /100 | #110 | Exceptional $53,715 |
| Immigrants | Colombia | 97.7 /100 | #111 | Exceptional $53,714 |
Demographics Similar to Ute by Householder Income Under 25 years
In terms of householder income under 25 years, the demographic groups most similar to Ute are Mexican ($49,989, a difference of 0.010%), Venezuelan ($50,011, a difference of 0.030%), Immigrants from Laos ($50,041, a difference of 0.090%), Immigrants from Venezuela ($50,109, a difference of 0.22%), and Belgian ($50,113, a difference of 0.23%).
| Demographics | Rating | Rank | Householder Income Under 25 years |
| Haitians | 0.8 /100 | #262 | Tragic $50,231 |
| Immigrants | Dominican Republic | 0.8 /100 | #263 | Tragic $50,204 |
| Fijians | 0.6 /100 | #264 | Tragic $50,132 |
| Belgians | 0.6 /100 | #265 | Tragic $50,113 |
| Immigrants | Venezuela | 0.6 /100 | #266 | Tragic $50,109 |
| Immigrants | Laos | 0.5 /100 | #267 | Tragic $50,041 |
| Venezuelans | 0.5 /100 | #268 | Tragic $50,011 |
| Ute | 0.5 /100 | #269 | Tragic $49,997 |
| Mexicans | 0.5 /100 | #270 | Tragic $49,989 |
| Taiwanese | 0.3 /100 | #271 | Tragic $49,804 |
| Colville | 0.3 /100 | #272 | Tragic $49,774 |
| Slovaks | 0.3 /100 | #273 | Tragic $49,753 |
| Immigrants | Senegal | 0.3 /100 | #274 | Tragic $49,742 |
| Immigrants | Kenya | 0.2 /100 | #275 | Tragic $49,633 |
| Dominicans | 0.2 /100 | #276 | Tragic $49,633 |