Ethiopian vs Ute Unemployment Among Ages 65 to 74 years
COMPARE
Ethiopian
Ute
Unemployment Among Ages 65 to 74 years
Unemployment Among Ages 65 to 74 years Comparison
Ethiopians
Ute
5.0%
UNEMPLOYMENT AMONG AGES 65 TO 74 YEARS
100.0/ 100
METRIC RATING
29th/ 347
METRIC RANK
6.5%
UNEMPLOYMENT AMONG AGES 65 TO 74 YEARS
0.0/ 100
METRIC RATING
337th/ 347
METRIC RANK
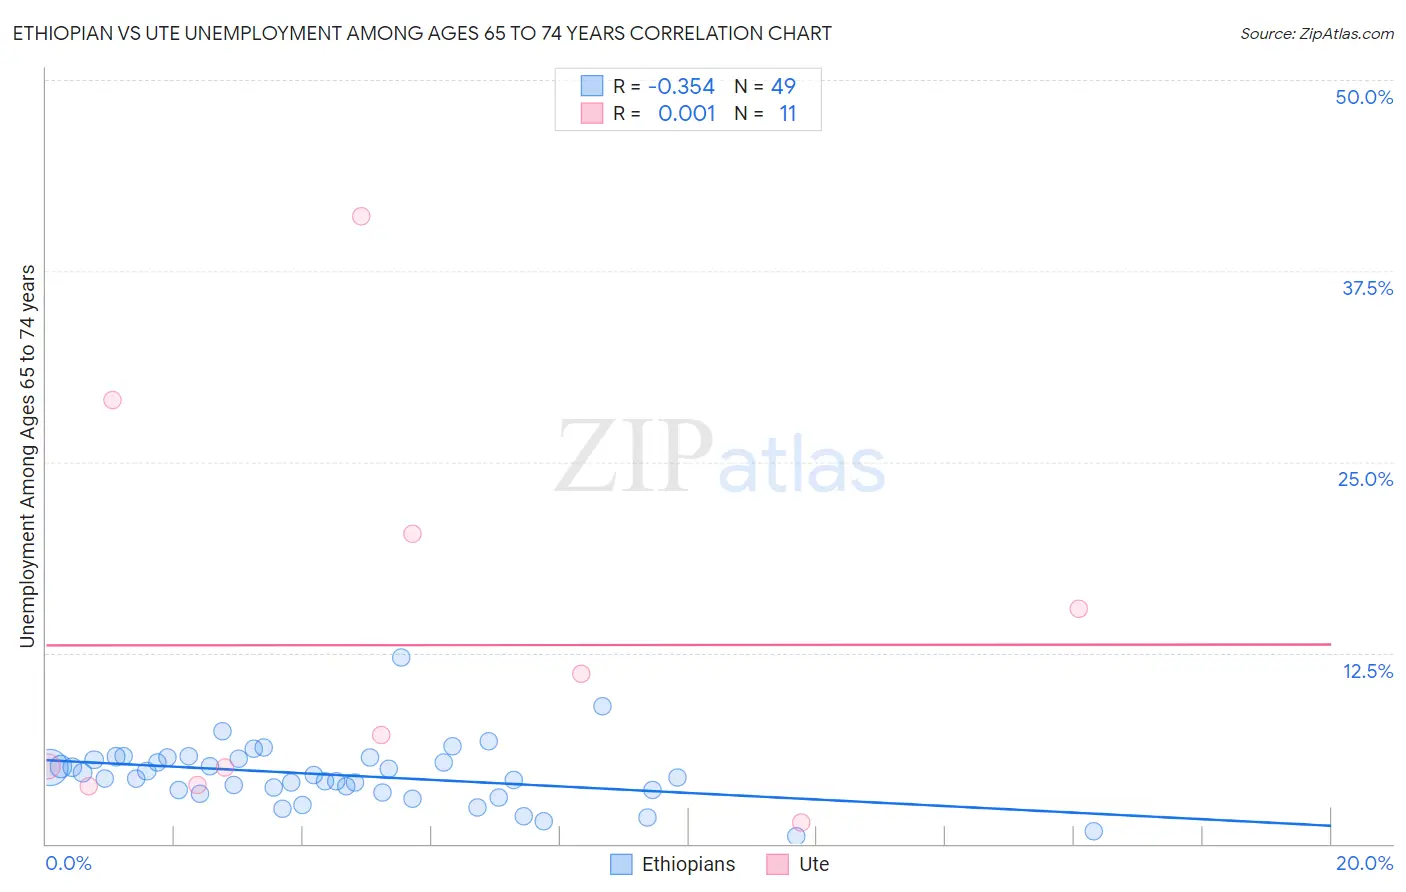
Ethiopian vs Ute Unemployment Among Ages 65 to 74 years Correlation Chart
The statistical analysis conducted on geographies consisting of 206,778,623 people shows a mild negative correlation between the proportion of Ethiopians and unemployment rate among population between the ages 65 and 74 in the United States with a correlation coefficient (R) of -0.354 and weighted average of 5.0%. Similarly, the statistical analysis conducted on geographies consisting of 52,734,815 people shows no correlation between the proportion of Ute and unemployment rate among population between the ages 65 and 74 in the United States with a correlation coefficient (R) of 0.001 and weighted average of 6.5%, a difference of 30.8%.
Unemployment Among Ages 65 to 74 years Correlation Summary
| Measurement | Ethiopian | Ute |
| Minimum | 0.50% | 1.4% |
| Maximum | 12.2% | 41.1% |
| Range | 11.7% | 39.7% |
| Mean | 4.5% | 13.0% |
| Median | 4.4% | 7.1% |
| Interquartile 25% (IQ1) | 3.4% | 3.8% |
| Interquartile 75% (IQ3) | 5.6% | 20.3% |
| Interquartile Range (IQR) | 2.1% | 16.4% |
| Standard Deviation (Sample) | 2.0% | 12.6% |
| Standard Deviation (Population) | 2.0% | 12.0% |
Similar Demographics by Unemployment Among Ages 65 to 74 years
Demographics Similar to Ethiopians by Unemployment Among Ages 65 to 74 years
In terms of unemployment among ages 65 to 74 years, the demographic groups most similar to Ethiopians are Immigrants from Lebanon (5.0%, a difference of 0.090%), Slovene (5.0%, a difference of 0.19%), Bulgarian (5.0%, a difference of 0.45%), Palestinian (5.0%, a difference of 0.47%), and Belgian (5.0%, a difference of 0.52%).
| Demographics | Rating | Rank | Unemployment Among Ages 65 to 74 years |
| Lebanese | 100.0 /100 | #22 | Exceptional 4.9% |
| Immigrants | Nepal | 100.0 /100 | #23 | Exceptional 4.9% |
| Iraqis | 100.0 /100 | #24 | Exceptional 4.9% |
| Macedonians | 100.0 /100 | #25 | Exceptional 5.0% |
| Czechs | 100.0 /100 | #26 | Exceptional 5.0% |
| Norwegians | 100.0 /100 | #27 | Exceptional 5.0% |
| Bulgarians | 100.0 /100 | #28 | Exceptional 5.0% |
| Ethiopians | 100.0 /100 | #29 | Exceptional 5.0% |
| Immigrants | Lebanon | 100.0 /100 | #30 | Exceptional 5.0% |
| Slovenes | 100.0 /100 | #31 | Exceptional 5.0% |
| Palestinians | 100.0 /100 | #32 | Exceptional 5.0% |
| Belgians | 100.0 /100 | #33 | Exceptional 5.0% |
| Cambodians | 100.0 /100 | #34 | Exceptional 5.0% |
| Bhutanese | 100.0 /100 | #35 | Exceptional 5.0% |
| Immigrants | Kuwait | 99.9 /100 | #36 | Exceptional 5.0% |
Demographics Similar to Ute by Unemployment Among Ages 65 to 74 years
In terms of unemployment among ages 65 to 74 years, the demographic groups most similar to Ute are Tlingit-Haida (6.5%, a difference of 0.10%), Yakama (6.6%, a difference of 0.46%), Immigrants from Armenia (6.5%, a difference of 0.76%), Pima (6.6%, a difference of 1.3%), and Puerto Rican (6.4%, a difference of 2.4%).
| Demographics | Rating | Rank | Unemployment Among Ages 65 to 74 years |
| Dominicans | 0.0 /100 | #330 | Tragic 6.3% |
| Bermudans | 0.0 /100 | #331 | Tragic 6.3% |
| Immigrants | Dominican Republic | 0.0 /100 | #332 | Tragic 6.3% |
| Paiute | 0.0 /100 | #333 | Tragic 6.3% |
| Taiwanese | 0.0 /100 | #334 | Tragic 6.3% |
| Puerto Ricans | 0.0 /100 | #335 | Tragic 6.4% |
| Immigrants | Armenia | 0.0 /100 | #336 | Tragic 6.5% |
| Ute | 0.0 /100 | #337 | Tragic 6.5% |
| Tlingit-Haida | 0.0 /100 | #338 | Tragic 6.5% |
| Yakama | 0.0 /100 | #339 | Tragic 6.6% |
| Pima | 0.0 /100 | #340 | Tragic 6.6% |
| Alaska Natives | 0.0 /100 | #341 | Tragic 6.8% |
| Navajo | 0.0 /100 | #342 | Tragic 6.9% |
| Alaskan Athabascans | 0.0 /100 | #343 | Tragic 7.4% |
| Inupiat | 0.0 /100 | #344 | Tragic 7.5% |