Immigrants from Sudan vs Ute Householder Income Under 25 years
COMPARE
Immigrants from Sudan
Ute
Householder Income Under 25 years
Householder Income Under 25 years Comparison
Immigrants from Sudan
Ute
$46,791
HOUSEHOLDER INCOME UNDER 25 YEARS
0.0/ 100
METRIC RATING
320th/ 347
METRIC RANK
$49,997
HOUSEHOLDER INCOME UNDER 25 YEARS
0.5/ 100
METRIC RATING
269th/ 347
METRIC RANK
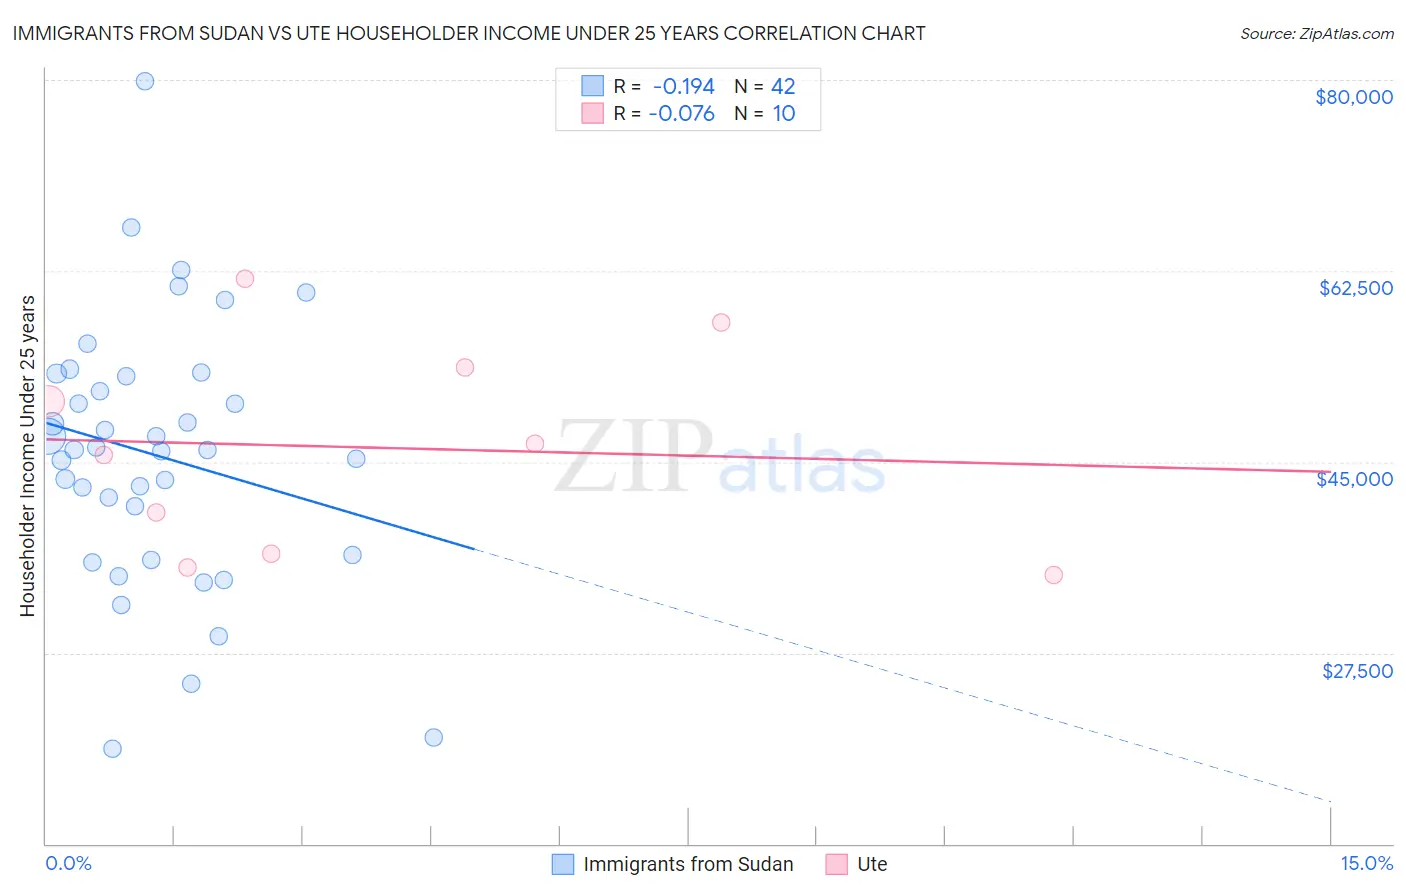
Immigrants from Sudan vs Ute Householder Income Under 25 years Correlation Chart
The statistical analysis conducted on geographies consisting of 112,922,604 people shows a poor negative correlation between the proportion of Immigrants from Sudan and household income with householder under the age of 25 in the United States with a correlation coefficient (R) of -0.194 and weighted average of $46,791. Similarly, the statistical analysis conducted on geographies consisting of 53,586,757 people shows a slight negative correlation between the proportion of Ute and household income with householder under the age of 25 in the United States with a correlation coefficient (R) of -0.076 and weighted average of $49,997, a difference of 6.9%.
Householder Income Under 25 years Correlation Summary
| Measurement | Immigrants from Sudan | Ute |
| Minimum | $18,750 | $34,583 |
| Maximum | $79,888 | $61,768 |
| Range | $61,138 | $27,185 |
| Mean | $45,607 | $46,291 |
| Median | $46,081 | $46,136 |
| Interquartile 25% (IQ1) | $36,434 | $36,563 |
| Interquartile 75% (IQ3) | $52,896 | $53,646 |
| Interquartile Range (IQR) | $16,462 | $17,083 |
| Standard Deviation (Sample) | $12,123 | $9,620 |
| Standard Deviation (Population) | $11,978 | $9,126 |
Similar Demographics by Householder Income Under 25 years
Demographics Similar to Immigrants from Sudan by Householder Income Under 25 years
In terms of householder income under 25 years, the demographic groups most similar to Immigrants from Sudan are African ($46,838, a difference of 0.10%), Spanish American ($46,913, a difference of 0.26%), Hopi ($46,978, a difference of 0.40%), Sudanese ($46,982, a difference of 0.41%), and Crow ($47,012, a difference of 0.47%).
| Demographics | Rating | Rank | Householder Income Under 25 years |
| Delaware | 0.0 /100 | #313 | Tragic $47,159 |
| Chippewa | 0.0 /100 | #314 | Tragic $47,015 |
| Crow | 0.0 /100 | #315 | Tragic $47,012 |
| Sudanese | 0.0 /100 | #316 | Tragic $46,982 |
| Hopi | 0.0 /100 | #317 | Tragic $46,978 |
| Spanish Americans | 0.0 /100 | #318 | Tragic $46,913 |
| Africans | 0.0 /100 | #319 | Tragic $46,838 |
| Immigrants | Sudan | 0.0 /100 | #320 | Tragic $46,791 |
| Potawatomi | 0.0 /100 | #321 | Tragic $46,462 |
| Sioux | 0.0 /100 | #322 | Tragic $46,417 |
| Immigrants | Saudi Arabia | 0.0 /100 | #323 | Tragic $46,187 |
| Dutch West Indians | 0.0 /100 | #324 | Tragic $45,816 |
| Immigrants | Bahamas | 0.0 /100 | #325 | Tragic $45,793 |
| Osage | 0.0 /100 | #326 | Tragic $45,764 |
| Bahamians | 0.0 /100 | #327 | Tragic $45,743 |
Demographics Similar to Ute by Householder Income Under 25 years
In terms of householder income under 25 years, the demographic groups most similar to Ute are Mexican ($49,989, a difference of 0.010%), Venezuelan ($50,011, a difference of 0.030%), Immigrants from Laos ($50,041, a difference of 0.090%), Immigrants from Venezuela ($50,109, a difference of 0.22%), and Belgian ($50,113, a difference of 0.23%).
| Demographics | Rating | Rank | Householder Income Under 25 years |
| Haitians | 0.8 /100 | #262 | Tragic $50,231 |
| Immigrants | Dominican Republic | 0.8 /100 | #263 | Tragic $50,204 |
| Fijians | 0.6 /100 | #264 | Tragic $50,132 |
| Belgians | 0.6 /100 | #265 | Tragic $50,113 |
| Immigrants | Venezuela | 0.6 /100 | #266 | Tragic $50,109 |
| Immigrants | Laos | 0.5 /100 | #267 | Tragic $50,041 |
| Venezuelans | 0.5 /100 | #268 | Tragic $50,011 |
| Ute | 0.5 /100 | #269 | Tragic $49,997 |
| Mexicans | 0.5 /100 | #270 | Tragic $49,989 |
| Taiwanese | 0.3 /100 | #271 | Tragic $49,804 |
| Colville | 0.3 /100 | #272 | Tragic $49,774 |
| Slovaks | 0.3 /100 | #273 | Tragic $49,753 |
| Immigrants | Senegal | 0.3 /100 | #274 | Tragic $49,742 |
| Immigrants | Kenya | 0.2 /100 | #275 | Tragic $49,633 |
| Dominicans | 0.2 /100 | #276 | Tragic $49,633 |