Luxembourger vs Ute Householder Income Under 25 years
COMPARE
Luxembourger
Ute
Householder Income Under 25 years
Householder Income Under 25 years Comparison
Luxembourgers
Ute
$50,379
HOUSEHOLDER INCOME UNDER 25 YEARS
1.2/ 100
METRIC RATING
254th/ 347
METRIC RANK
$49,997
HOUSEHOLDER INCOME UNDER 25 YEARS
0.5/ 100
METRIC RATING
269th/ 347
METRIC RANK
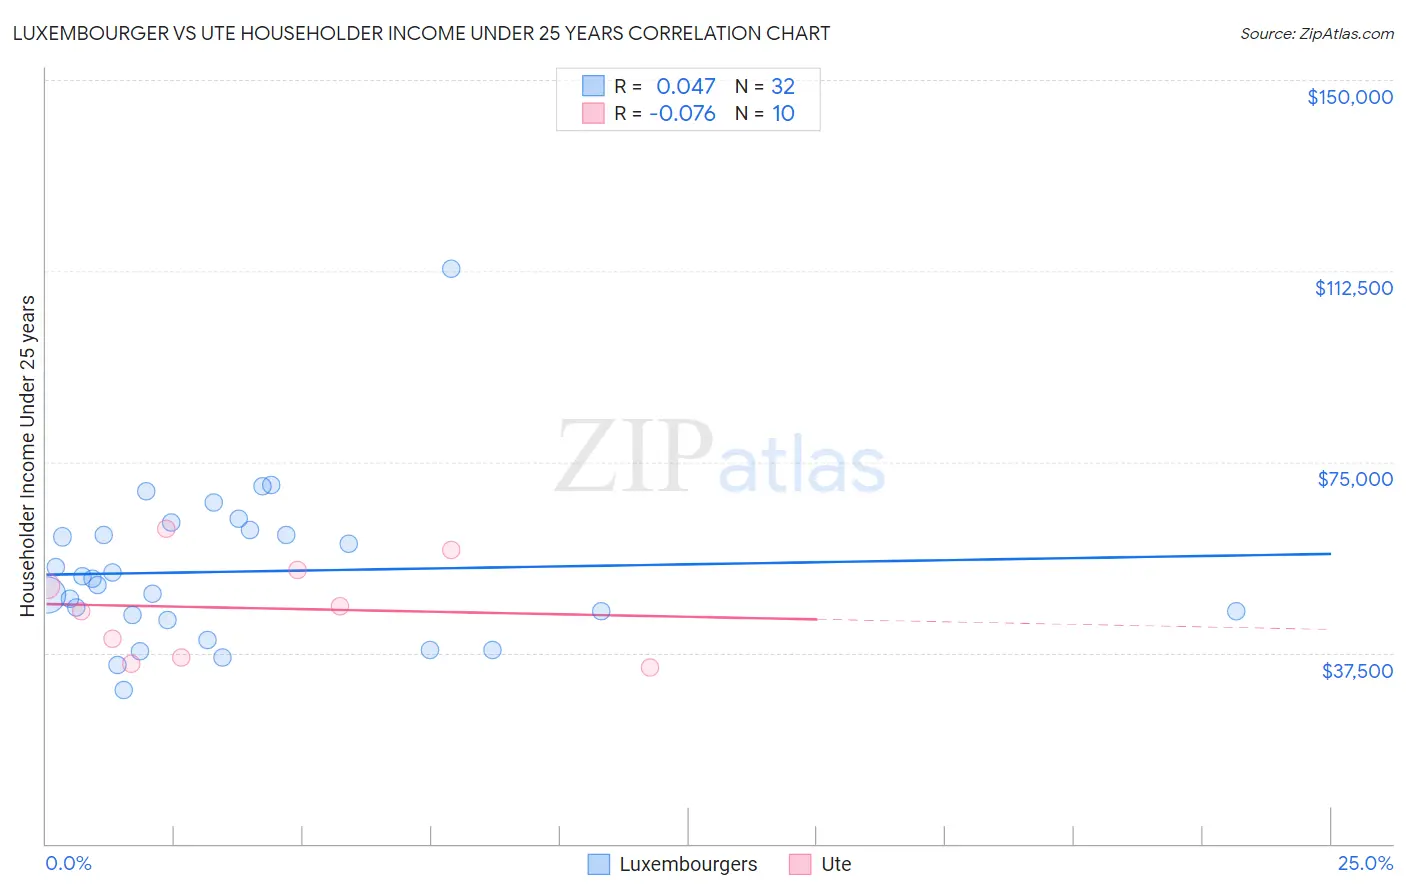
Luxembourger vs Ute Householder Income Under 25 years Correlation Chart
The statistical analysis conducted on geographies consisting of 133,229,514 people shows no correlation between the proportion of Luxembourgers and household income with householder under the age of 25 in the United States with a correlation coefficient (R) of 0.047 and weighted average of $50,379. Similarly, the statistical analysis conducted on geographies consisting of 53,586,757 people shows a slight negative correlation between the proportion of Ute and household income with householder under the age of 25 in the United States with a correlation coefficient (R) of -0.076 and weighted average of $49,997, a difference of 0.77%.
Householder Income Under 25 years Correlation Summary
| Measurement | Luxembourger | Ute |
| Minimum | $30,181 | $34,583 |
| Maximum | $112,908 | $61,768 |
| Range | $82,726 | $27,185 |
| Mean | $53,440 | $46,291 |
| Median | $51,427 | $46,136 |
| Interquartile 25% (IQ1) | $44,462 | $36,563 |
| Interquartile 75% (IQ3) | $61,145 | $53,646 |
| Interquartile Range (IQR) | $16,682 | $17,083 |
| Standard Deviation (Sample) | $15,505 | $9,620 |
| Standard Deviation (Population) | $15,261 | $9,126 |
Demographics Similar to Luxembourgers and Ute by Householder Income Under 25 years
In terms of householder income under 25 years, the demographic groups most similar to Luxembourgers are Aleut ($50,377, a difference of 0.010%), Immigrants from Cuba ($50,374, a difference of 0.010%), Immigrants from Haiti ($50,398, a difference of 0.040%), Lebanese ($50,355, a difference of 0.050%), and Immigrants from Mexico ($50,422, a difference of 0.080%). Similarly, the demographic groups most similar to Ute are Mexican ($49,989, a difference of 0.010%), Venezuelan ($50,011, a difference of 0.030%), Immigrants from Laos ($50,041, a difference of 0.090%), Immigrants from Venezuela ($50,109, a difference of 0.22%), and Belgian ($50,113, a difference of 0.23%).
| Demographics | Rating | Rank | Householder Income Under 25 years |
| Celtics | 1.4 /100 | #251 | Tragic $50,447 |
| Immigrants | Mexico | 1.3 /100 | #252 | Tragic $50,422 |
| Immigrants | Haiti | 1.2 /100 | #253 | Tragic $50,398 |
| Luxembourgers | 1.2 /100 | #254 | Tragic $50,379 |
| Aleuts | 1.2 /100 | #255 | Tragic $50,377 |
| Immigrants | Cuba | 1.2 /100 | #256 | Tragic $50,374 |
| Lebanese | 1.1 /100 | #257 | Tragic $50,355 |
| Whites/Caucasians | 1.1 /100 | #258 | Tragic $50,336 |
| Immigrants | Dominica | 1.0 /100 | #259 | Tragic $50,301 |
| Hispanics or Latinos | 0.9 /100 | #260 | Tragic $50,279 |
| Hungarians | 0.9 /100 | #261 | Tragic $50,247 |
| Haitians | 0.8 /100 | #262 | Tragic $50,231 |
| Immigrants | Dominican Republic | 0.8 /100 | #263 | Tragic $50,204 |
| Fijians | 0.6 /100 | #264 | Tragic $50,132 |
| Belgians | 0.6 /100 | #265 | Tragic $50,113 |
| Immigrants | Venezuela | 0.6 /100 | #266 | Tragic $50,109 |
| Immigrants | Laos | 0.5 /100 | #267 | Tragic $50,041 |
| Venezuelans | 0.5 /100 | #268 | Tragic $50,011 |
| Ute | 0.5 /100 | #269 | Tragic $49,997 |
| Mexicans | 0.5 /100 | #270 | Tragic $49,989 |
| Taiwanese | 0.3 /100 | #271 | Tragic $49,804 |