Mexican vs Thai Householder Income Under 25 years
COMPARE
Mexican
Thai
Householder Income Under 25 years
Householder Income Under 25 years Comparison
Mexicans
Thais
$49,989
HOUSEHOLDER INCOME UNDER 25 YEARS
0.5/ 100
METRIC RATING
270th/ 347
METRIC RANK
$59,187
HOUSEHOLDER INCOME UNDER 25 YEARS
100.0/ 100
METRIC RATING
6th/ 347
METRIC RANK
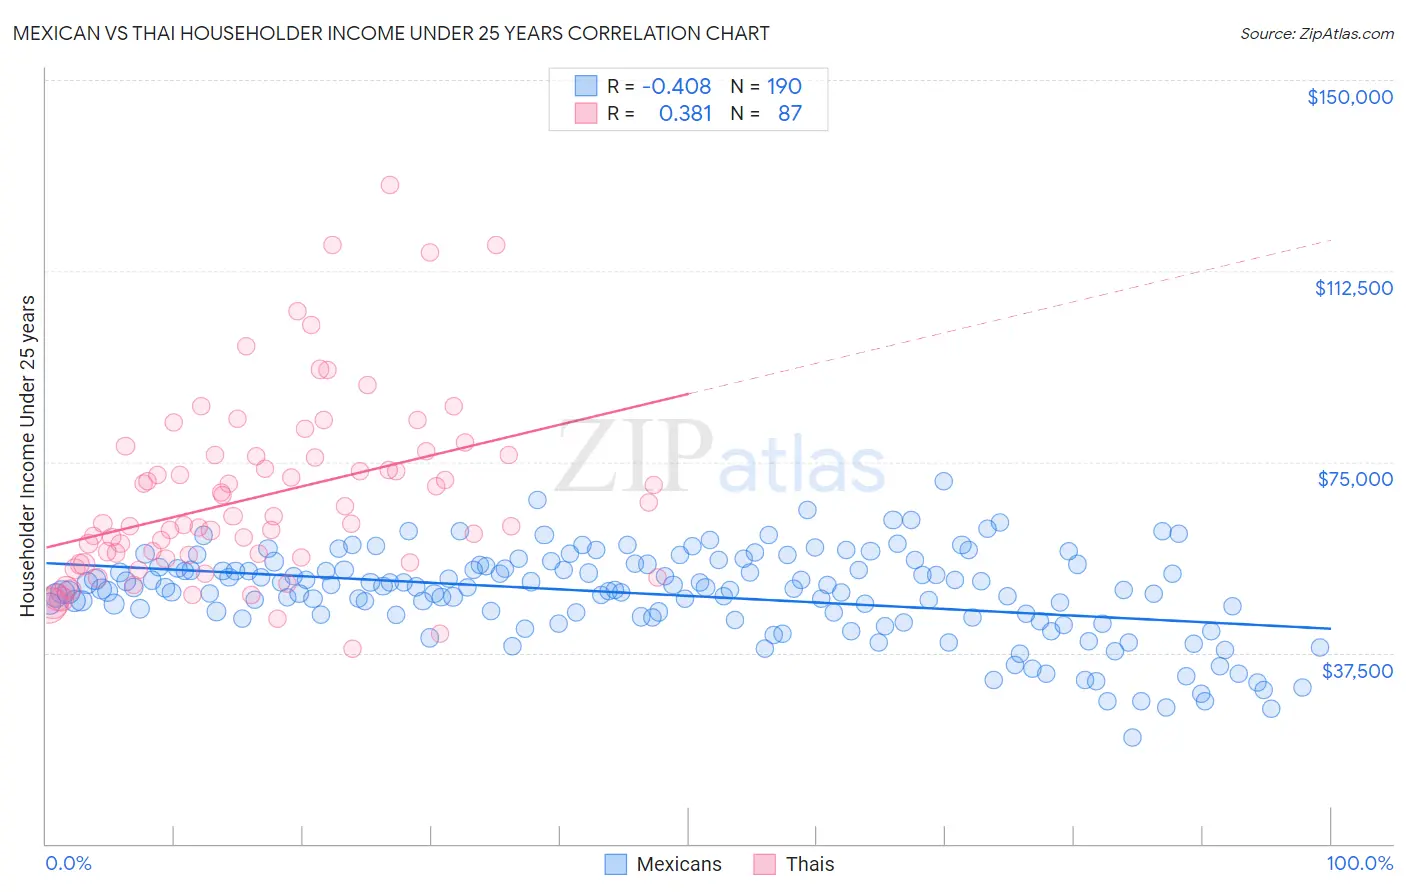
Mexican vs Thai Householder Income Under 25 years Correlation Chart
The statistical analysis conducted on geographies consisting of 438,958,385 people shows a moderate negative correlation between the proportion of Mexicans and household income with householder under the age of 25 in the United States with a correlation coefficient (R) of -0.408 and weighted average of $49,989. Similarly, the statistical analysis conducted on geographies consisting of 390,520,827 people shows a mild positive correlation between the proportion of Thais and household income with householder under the age of 25 in the United States with a correlation coefficient (R) of 0.381 and weighted average of $59,187, a difference of 18.4%.
Householder Income Under 25 years Correlation Summary
| Measurement | Mexican | Thai |
| Minimum | $20,927 | $38,359 |
| Maximum | $71,283 | $129,301 |
| Range | $50,356 | $90,942 |
| Mean | $48,982 | $68,286 |
| Median | $50,141 | $62,959 |
| Interquartile 25% (IQ1) | $44,588 | $56,029 |
| Interquartile 75% (IQ3) | $54,345 | $76,245 |
| Interquartile Range (IQR) | $9,757 | $20,216 |
| Standard Deviation (Sample) | $8,735 | $17,960 |
| Standard Deviation (Population) | $8,712 | $17,857 |
Similar Demographics by Householder Income Under 25 years
Demographics Similar to Mexicans by Householder Income Under 25 years
In terms of householder income under 25 years, the demographic groups most similar to Mexicans are Ute ($49,997, a difference of 0.010%), Venezuelan ($50,011, a difference of 0.040%), Immigrants from Laos ($50,041, a difference of 0.10%), Immigrants from Venezuela ($50,109, a difference of 0.24%), and Belgian ($50,113, a difference of 0.25%).
| Demographics | Rating | Rank | Householder Income Under 25 years |
| Immigrants | Dominican Republic | 0.8 /100 | #263 | Tragic $50,204 |
| Fijians | 0.6 /100 | #264 | Tragic $50,132 |
| Belgians | 0.6 /100 | #265 | Tragic $50,113 |
| Immigrants | Venezuela | 0.6 /100 | #266 | Tragic $50,109 |
| Immigrants | Laos | 0.5 /100 | #267 | Tragic $50,041 |
| Venezuelans | 0.5 /100 | #268 | Tragic $50,011 |
| Ute | 0.5 /100 | #269 | Tragic $49,997 |
| Mexicans | 0.5 /100 | #270 | Tragic $49,989 |
| Taiwanese | 0.3 /100 | #271 | Tragic $49,804 |
| Colville | 0.3 /100 | #272 | Tragic $49,774 |
| Slovaks | 0.3 /100 | #273 | Tragic $49,753 |
| Immigrants | Senegal | 0.3 /100 | #274 | Tragic $49,742 |
| Immigrants | Kenya | 0.2 /100 | #275 | Tragic $49,633 |
| Dominicans | 0.2 /100 | #276 | Tragic $49,633 |
| Immigrants | Western Africa | 0.2 /100 | #277 | Tragic $49,621 |
Demographics Similar to Thais by Householder Income Under 25 years
In terms of householder income under 25 years, the demographic groups most similar to Thais are Immigrants from Bolivia ($59,389, a difference of 0.34%), Immigrants from Taiwan ($59,424, a difference of 0.40%), Bolivian ($58,506, a difference of 1.2%), Immigrants from India ($59,914, a difference of 1.2%), and Indian (Asian) ($58,239, a difference of 1.6%).
| Demographics | Rating | Rank | Householder Income Under 25 years |
| Assyrians/Chaldeans/Syriacs | 100.0 /100 | #1 | Exceptional $65,329 |
| Immigrants | Hong Kong | 100.0 /100 | #2 | Exceptional $62,083 |
| Immigrants | India | 100.0 /100 | #3 | Exceptional $59,914 |
| Immigrants | Taiwan | 100.0 /100 | #4 | Exceptional $59,424 |
| Immigrants | Bolivia | 100.0 /100 | #5 | Exceptional $59,389 |
| Thais | 100.0 /100 | #6 | Exceptional $59,187 |
| Bolivians | 100.0 /100 | #7 | Exceptional $58,506 |
| Indians (Asian) | 100.0 /100 | #8 | Exceptional $58,239 |
| Chinese | 100.0 /100 | #9 | Exceptional $58,162 |
| Afghans | 100.0 /100 | #10 | Exceptional $58,019 |
| Immigrants | China | 100.0 /100 | #11 | Exceptional $57,931 |
| Immigrants | Philippines | 100.0 /100 | #12 | Exceptional $57,930 |
| Immigrants | South Central Asia | 100.0 /100 | #13 | Exceptional $57,818 |
| Filipinos | 100.0 /100 | #14 | Exceptional $57,740 |
| Koreans | 100.0 /100 | #15 | Exceptional $57,730 |