Immigrants from Denmark vs Immigrants from Moldova Median Male Earnings
COMPARE
Immigrants from Denmark
Immigrants from Moldova
Median Male Earnings
Median Male Earnings Comparison
Immigrants from Denmark
Immigrants from Moldova
$64,625
MEDIAN MALE EARNINGS
100.0/ 100
METRIC RATING
25th/ 347
METRIC RANK
$59,417
MEDIAN MALE EARNINGS
99.2/ 100
METRIC RATING
89th/ 347
METRIC RANK
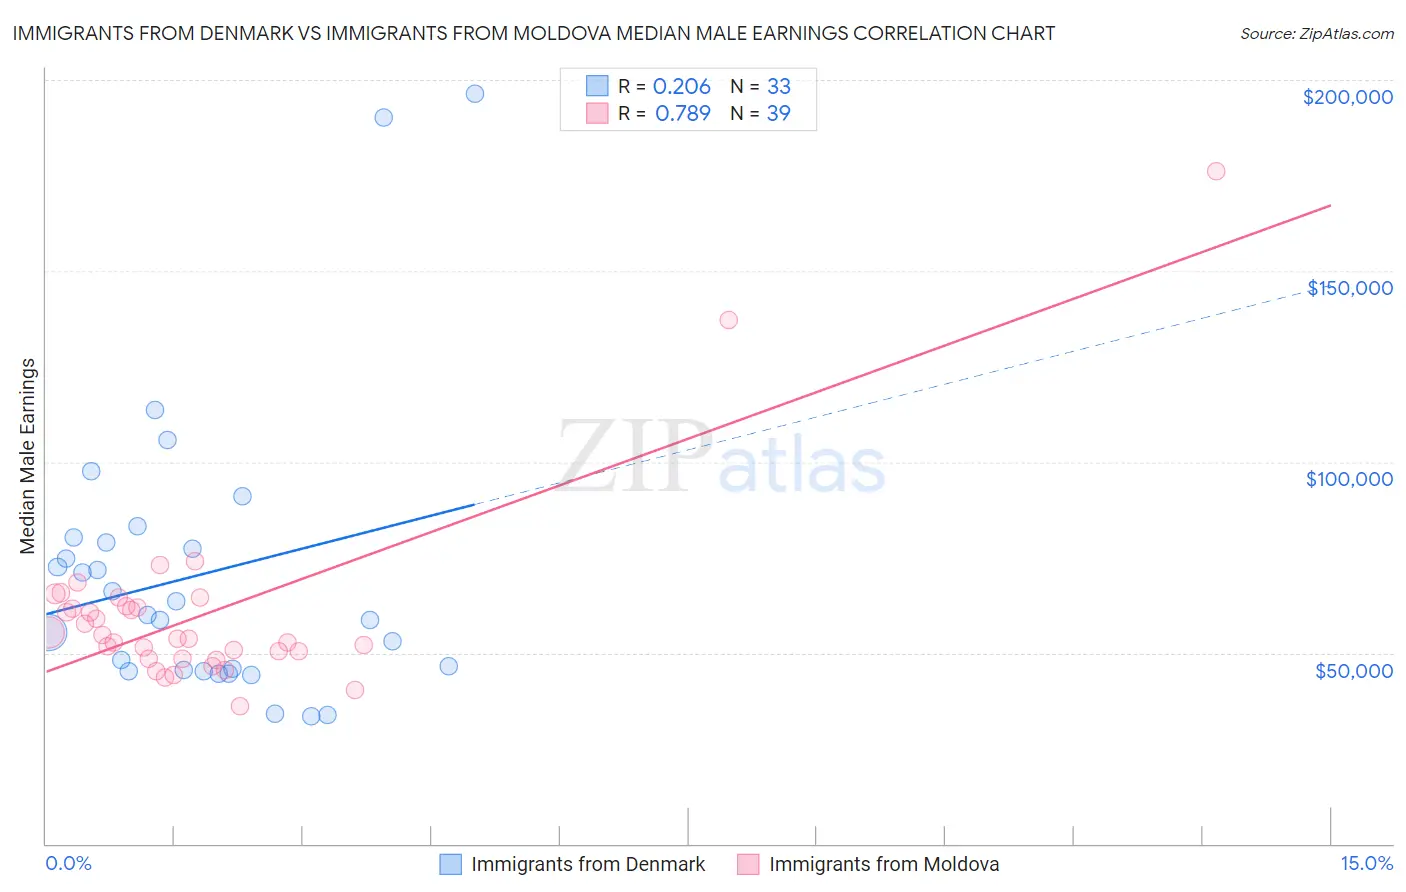
Immigrants from Denmark vs Immigrants from Moldova Median Male Earnings Correlation Chart
The statistical analysis conducted on geographies consisting of 136,409,110 people shows a weak positive correlation between the proportion of Immigrants from Denmark and median male earnings in the United States with a correlation coefficient (R) of 0.206 and weighted average of $64,625. Similarly, the statistical analysis conducted on geographies consisting of 124,394,604 people shows a strong positive correlation between the proportion of Immigrants from Moldova and median male earnings in the United States with a correlation coefficient (R) of 0.789 and weighted average of $59,417, a difference of 8.8%.
Median Male Earnings Correlation Summary
| Measurement | Immigrants from Denmark | Immigrants from Moldova |
| Minimum | $33,446 | $35,909 |
| Maximum | $196,250 | $176,076 |
| Range | $162,804 | $140,167 |
| Mean | $70,566 | $60,240 |
| Median | $59,978 | $53,815 |
| Interquartile 25% (IQ1) | $45,341 | $48,477 |
| Interquartile 75% (IQ3) | $79,588 | $62,160 |
| Interquartile Range (IQR) | $34,248 | $13,683 |
| Standard Deviation (Sample) | $37,718 | $24,701 |
| Standard Deviation (Population) | $37,142 | $24,383 |
Similar Demographics by Median Male Earnings
Demographics Similar to Immigrants from Denmark by Median Male Earnings
In terms of median male earnings, the demographic groups most similar to Immigrants from Denmark are Immigrants from Northern Europe ($64,987, a difference of 0.56%), Turkish ($64,253, a difference of 0.58%), Immigrants from Korea ($65,079, a difference of 0.70%), Burmese ($65,236, a difference of 0.95%), and Immigrants from Switzerland ($63,944, a difference of 1.1%).
| Demographics | Rating | Rank | Median Male Earnings |
| Indians (Asian) | 100.0 /100 | #18 | Exceptional $66,078 |
| Cypriots | 100.0 /100 | #19 | Exceptional $65,549 |
| Immigrants | Japan | 100.0 /100 | #20 | Exceptional $65,518 |
| Immigrants | Sweden | 100.0 /100 | #21 | Exceptional $65,406 |
| Burmese | 100.0 /100 | #22 | Exceptional $65,236 |
| Immigrants | Korea | 100.0 /100 | #23 | Exceptional $65,079 |
| Immigrants | Northern Europe | 100.0 /100 | #24 | Exceptional $64,987 |
| Immigrants | Denmark | 100.0 /100 | #25 | Exceptional $64,625 |
| Turks | 100.0 /100 | #26 | Exceptional $64,253 |
| Immigrants | Switzerland | 100.0 /100 | #27 | Exceptional $63,944 |
| Russians | 100.0 /100 | #28 | Exceptional $63,939 |
| Asians | 100.0 /100 | #29 | Exceptional $63,827 |
| Immigrants | France | 100.0 /100 | #30 | Exceptional $63,715 |
| Latvians | 100.0 /100 | #31 | Exceptional $63,498 |
| Soviet Union | 100.0 /100 | #32 | Exceptional $63,382 |
Demographics Similar to Immigrants from Moldova by Median Male Earnings
In terms of median male earnings, the demographic groups most similar to Immigrants from Moldova are Austrian ($59,359, a difference of 0.10%), Laotian ($59,351, a difference of 0.11%), Immigrants from Argentina ($59,491, a difference of 0.12%), Immigrants from England ($59,527, a difference of 0.18%), and Macedonian ($59,522, a difference of 0.18%).
| Demographics | Rating | Rank | Median Male Earnings |
| Croatians | 99.4 /100 | #82 | Exceptional $59,715 |
| Immigrants | Italy | 99.4 /100 | #83 | Exceptional $59,691 |
| Afghans | 99.3 /100 | #84 | Exceptional $59,554 |
| Italians | 99.3 /100 | #85 | Exceptional $59,551 |
| Immigrants | England | 99.3 /100 | #86 | Exceptional $59,527 |
| Macedonians | 99.3 /100 | #87 | Exceptional $59,522 |
| Immigrants | Argentina | 99.3 /100 | #88 | Exceptional $59,491 |
| Immigrants | Moldova | 99.2 /100 | #89 | Exceptional $59,417 |
| Austrians | 99.2 /100 | #90 | Exceptional $59,359 |
| Laotians | 99.2 /100 | #91 | Exceptional $59,351 |
| Immigrants | Kazakhstan | 99.1 /100 | #92 | Exceptional $59,278 |
| Immigrants | Southern Europe | 99.0 /100 | #93 | Exceptional $59,217 |
| Immigrants | North Macedonia | 99.0 /100 | #94 | Exceptional $59,189 |
| Immigrants | Lebanon | 98.6 /100 | #95 | Exceptional $58,835 |
| Albanians | 98.4 /100 | #96 | Exceptional $58,680 |